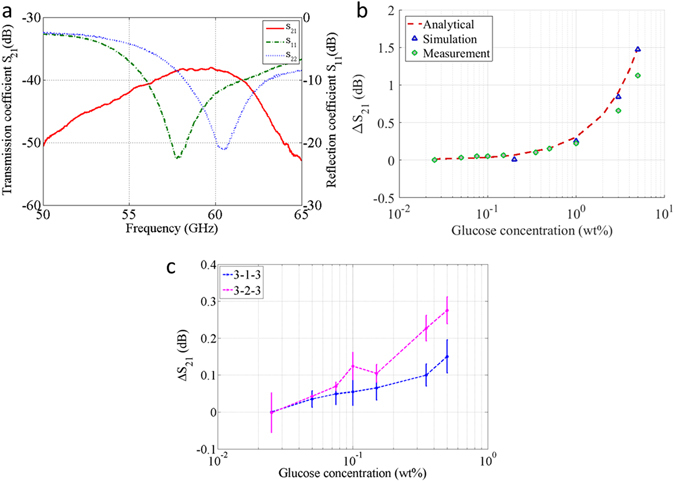
Figure 5.

The correlation between transmission coeffcient and glucose concentration. (a) Reflection and transmission coefficient vs. frequency for a 3-1-3 tank filled with pure water (b) ΔS21 for various glucose concentration from measurement, simulation and analytical calculation @ maximum trasnmission coefficient. (c) ΔS21 for 0–0.5% (smaller) glucose concentration from transmisison measurement for 3-1-3 and 3-2-3 tank @ maximum trasnmission coefficient. The plot has been shifted to zero for 0.025% since pure water (0%) is not seen in log scale. X axis has been plotted in log scale for both b & c to distinguish the lower concentrations. The error bar are standard deviation from three sets of measurements.
