
Figure 3.
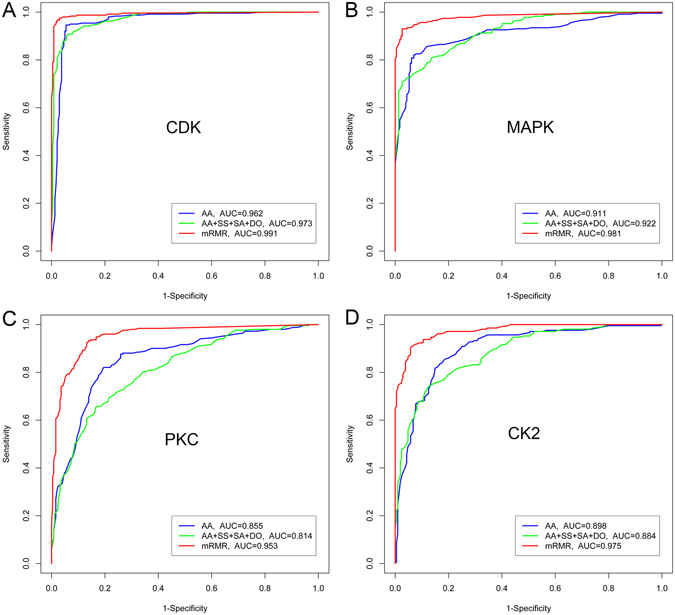
Phosphorylation site prediction. ROC curves for phosphorylation site prediction of three different sequence-encoding schemes: AA (amino acid sequence encoding), AA + SS + SA + DO (amino acid sequence + secondary structure + solvent accessibility + native disorder, without feature selection), and mRMR (mRMR feature selection based on all the extracted initial features), evaluated using 5-fold cross-validation tests on the benchmark datasets. Data represent (A) CDKs, (B) MAPKs, (C) PKC, and (D) CK2.