
Fig. 3.
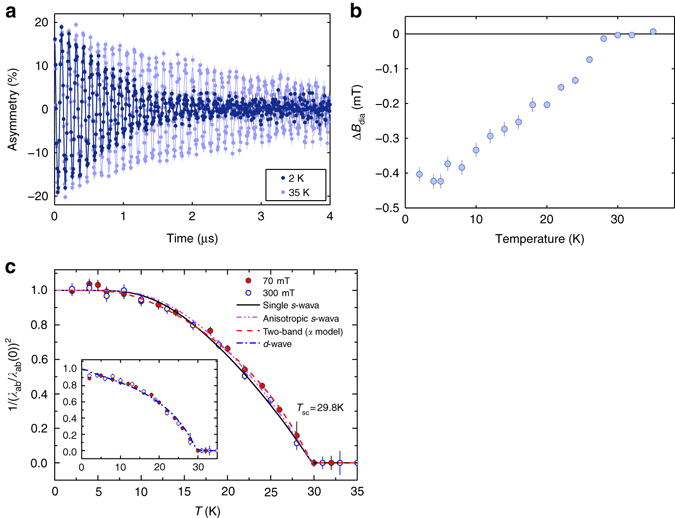
TF-μSR spectra, diamagnetic shift, and relaxation rate. a Representative TF-μSR spectra above and below T c measured in 70 mT and relevant fits. b Diamagnetic field-shifts in the superconducting phase. c Temperature dependence of λ −2, as calculated from the measured TF relaxation rate σ sc(T) at 70 mT (red) and 300 mT (yellow). Lines represent fits using a single-gap (solid) and two-gap or anisotropic s-wave model (dashed), the latter two showing a better . The inset shows a fit using a d-wave model