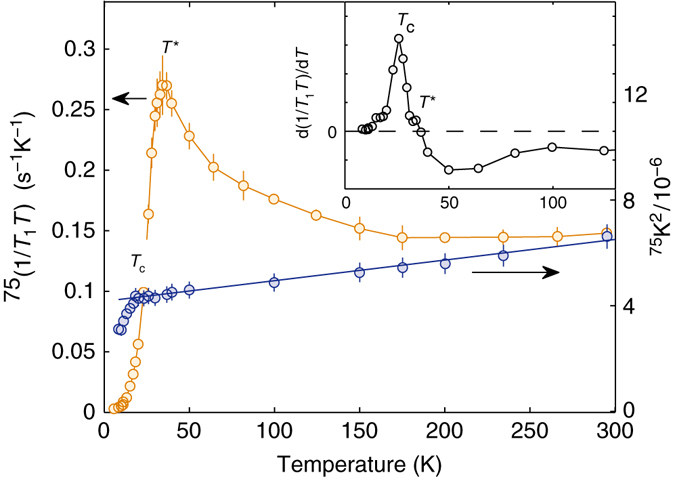
Fig. 5.

Different temperature behavior of 1/(T 1 T) and K 2. Temperature dependence of 1/(T 1 T) (left scale) and 75 K 2 shift (right scale) measured at 7 T. The peak in the former and the drop in the latter indicate T * and T c, respectively, which differ by ca. 5 K. The clearly different functional form of the two curves below ca. 150 K indicates the development of strong AF fluctuations. The strong low-temperature drop of 1/(T 1 T) confirms the bulk character of SC, whereas the peak in the derivative (inset) indicates its sharp onset
