
Figure 1.
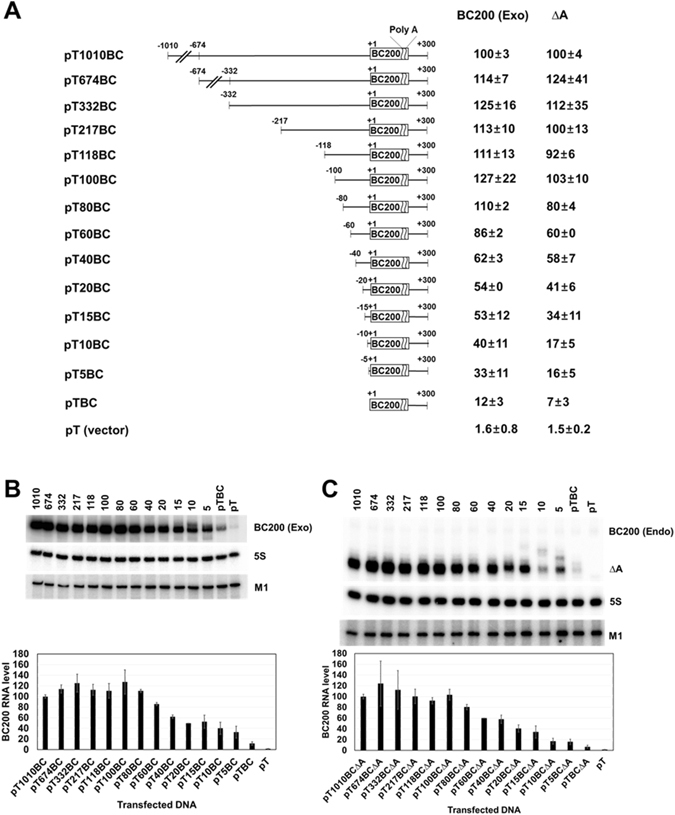
Effects of the 5′ upstream region on BC200 RNA transcription. (A) Schematic representation of BC200 RNA gene constructs containing different 5′ upstream sequences and their relative expression levels. The rectangle indicates the structural sequence of BC200 RNA, and the number refers to the 5′ end of the RNA. The constructs harboring the internally deleted BC200 RNA structural gene expressed RNAΔA, which lacks the A-rich region (from nts +123 to +157). The relative expression levels of exogenous BC200 RNA or RNAΔA were calculated by dividing their Northern blot signals by those of the M1 RNA (expressed from a cotransfected M1 RNA expression plasmid) after both sets of signals were normalized with respect to those of the 5S rRNA, as shown in panel B. Exogenous BC200 RNA signals were corrected by subtracting the endogenous signal obtained from cells transfected with the control vector. (B) Total RNAs were prepared from HeLa cells transfected with the indicated BC200 RNA-expressing constructs and subjected to Northern blot analysis. The cells were transfected with 0.64 pmole of plasmids expressing BC200 RNA or RNAΔ and 1 µg of the M1 RNA expressing plasmid. A representative blot is shown. The bar graph represents the relative expression levels of exogenous BC200 RNA. The indicated values were obtained from at least three independent experiments. (C) Total RNAs were analyzed with the indicated RNAΔA-expressing constructs as in Panel B. BC200 (Exo) and BC200 (Endo) stand for exogenous and endogenous BC200 RNA, respectively.