Figure 2.

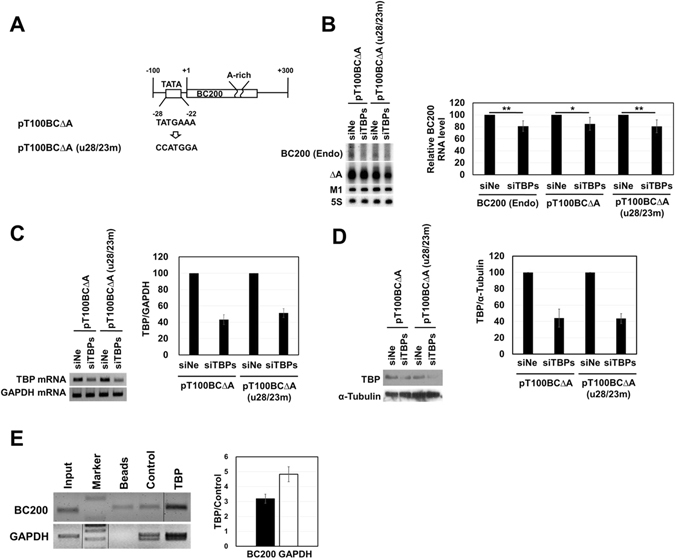
Effects of TBP on BC200 RNA transcription. (A) The putative TBP binding site (TATA box) and the mutated sequence (CCATGGA) are shown. (B) The effects of TATA-like sequence mutation (u28/23 m) and TBP knockdown on BC200 RNA transcription were examined. The −100 nt upstream constructs expressing RNAΔA with or without u28/23 m were introduced into HeLa cells treated with a mixture of TBP siRNAs (siTBP#1, #2, and #3) or a negative siRNA (siNe). The cells were transfected with 0.75 µg of plasmids expressing BC200 RNA or its derivatives, 0.5 µg of the M1 RNA expressing plasmid, and 15 pmole of each siRNA. RNA transcription levels were determined by Northern blotting. Three independent experiments were carried out. The relative expression levels of endogenous BC200 RNA and exogenous RNAΔA were calculated by dividing their Northern blot signals by those of the M1 RNA after both sets of signals were normalized with respect to the 5S rRNA signal. The ratio of expression in siTBP-treated cell to that in siNe-treated control cells is presented. *P < 0.05; **P < 0.01. (C and D) TBP knockdown was confirmed by semi qRT-PCR of TBP mRNA using GAPDH mRNA as a control (panel C), and by Western blotting of TBP protein using α-tubulin as a control (panel D). The amount of TBP mRNA was quantified by qRT-PCR and proteins was quantified using the ImageJ software. The knockdown efficiency was about 50% on both mRNA and protein levels. (E) ChIP analysis. TBP antibody-bound DNA fragments were used as PCR templates for amplifying the sequence between positions −100 and +30. TBP refers here to the TBP antibody; Beads refers to rProtein G-agarose beads alone; and Control indicates rabbit preimmune serum, which was used as a control antibody. A positive control ChIP assay was also carried out with the GAPDH promoter. Marker, DNA size marker. Input, a parallel analysis with 0.5% of the sheared formaldehyde-crosslinked-chromatin. The PCR products were analyzed by agarose gel electrophoresis (left) or the enrichment of PCR products relative to Control was analyzed by qPCR (right). BC200 (Endo), endogenous BC200 RNA. The spliced images from the same agarose gel were shown with the insertion of dividing lines between spliced lanes.
