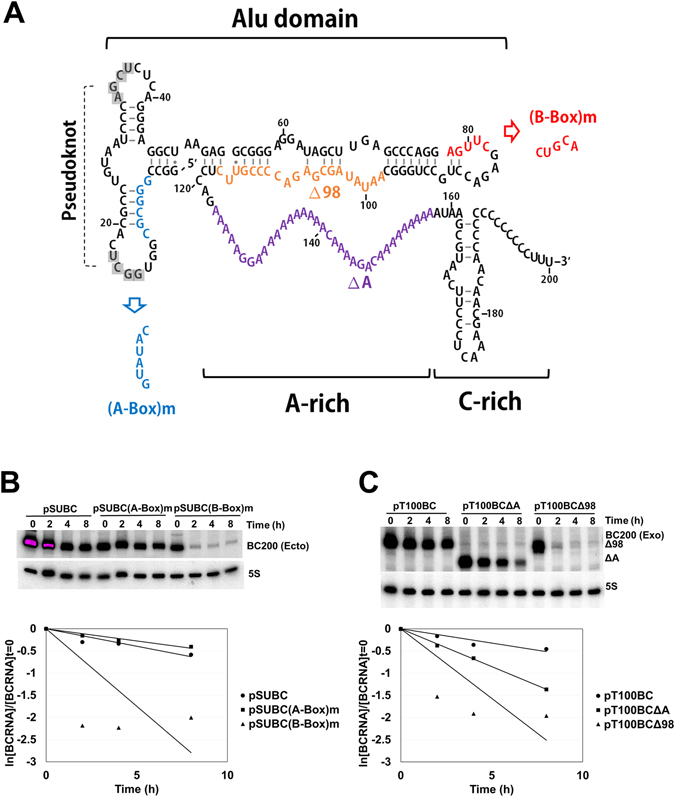
Figure 7.

Half-lives of BC200 RNA deletion or mutant derivatives. (A) Schematic diagrams of BC200 RNA (nts 1–200). Deleted sequences were shown in orange for RNAΔ98-117 and purple for RNAΔA. Mutated sequences were also shown in blue for RNA(A-Box)m and red for RNA(B-Box)m. Alu domain (nts 1–122), A-rich region (nts 123–158) and C-rich region (nts 159–200) were indicated. Total cellular RNA was isolated from HeLa cells transfected with −100 nt upstream constructs expressing BC200 RNA mutants or deletion derivatives, and the half-lives of the BC200 RNA mutant (B) or deletion (C) derivatives were analyzed as described in the legend to Fig. 6. The cells were transfected with 1 µg of plasmids expressing BC200 RNA or its derivatives. The remaining BC200 RNA levels (ln[BC200]/[BC200]t = 0) are also plotted versus time in hours. BC200 (Ecto) and BC200 (Exo) stand for ectopic and exogenous BC200 RNA, respectively.
