Figure 1.

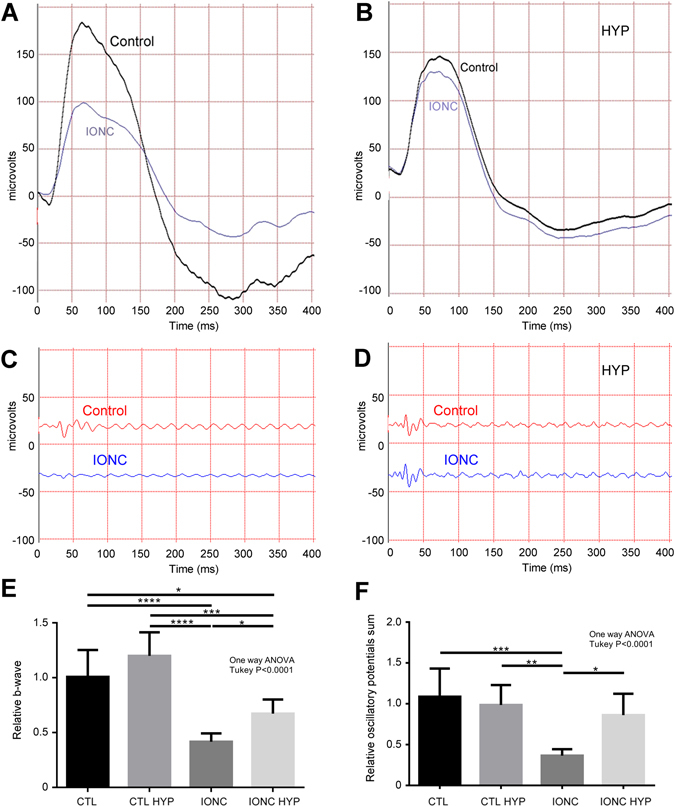
Representative electroretinograms showing the a- and b-waves (A,B) and the oscillatory potentials (C,D) of the right (sham-operated, control) and the left (IONC) eye of experimental rats kept at room temperature (A,C) or subjected to therapeutic hypothermia (B,D). Quantification of the relative (left eye/right eye) b-waves (E) and oscillatory potentials (F) are represented as histograms for the 4 experimental groups: sham-operated rats (CTL), sham rats treated with hypothermia (CTL HYP), rats subjected to IONC (IONC), and animals subjected to IONC and treated with hypothermia (IONC HYP). Bars represent the mean ± SD of all samples (n = 10 animals per group). Asterisks represent statistically significant differences. *p < 0.05; **p < 0.01; ***p < 0.001; ****p < 0.0001.
