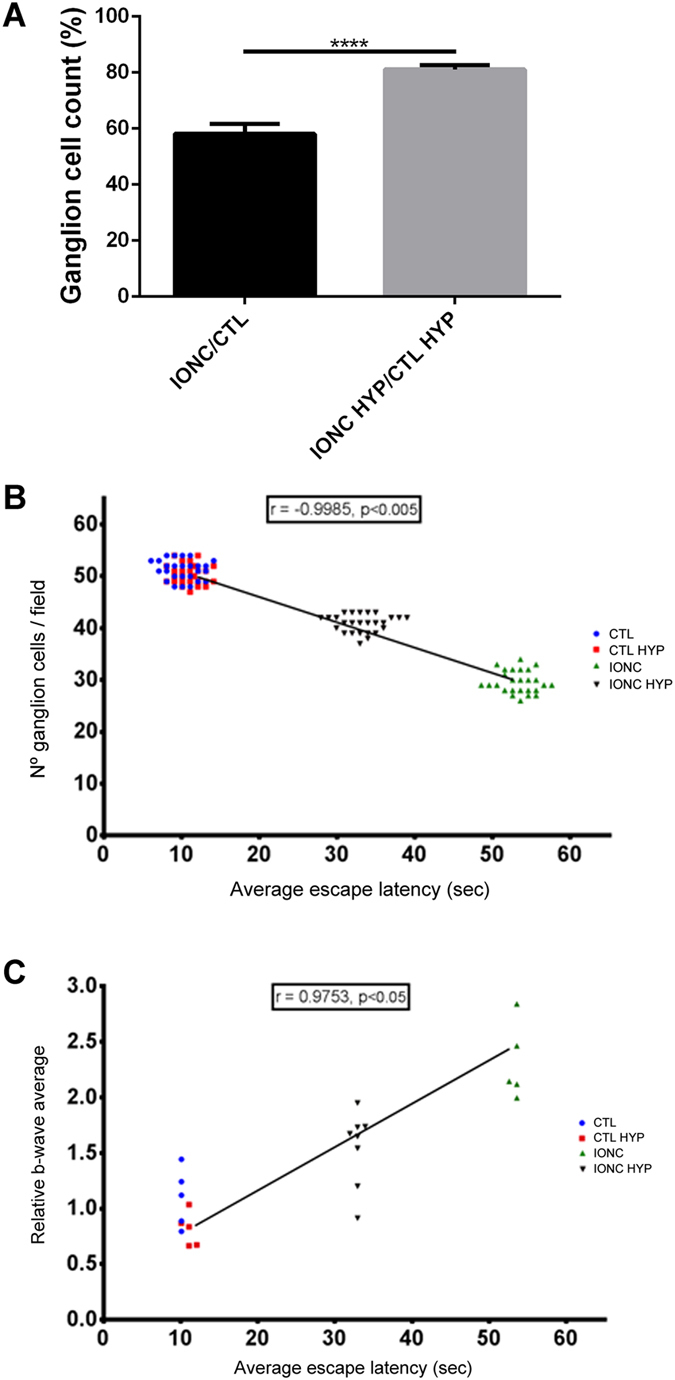
Figure 5.

Variations in the number of RGCs and correlations between the average escape latency and the number of RGCs or the b-wave. (A) Number of ganglion cells per 25x objective microscopic field in the retina was determined and is represented as a ratio between the IONC-operated eye and its sham control. Hypothermia greatly reduced the destruction of RGCs. Bars represent the mean ± SD of all samples (n = 16 animals per group). Asterisks represent statistically significant differences. ****p < 0.0001. (B) Correlation study between the escape latency as measured in the modified water maze and the number of RGCs per microscopic filed. A highly significant correlation was detected with animals having more RGCs taking shorter times to find the escape platform. (C) Correlation study between the escape latency and the modification in the b-wave pattern observed by electroretinography. A significant positive correlation was detected with animals taking longer to find the escape platform having a more irregular electrophysiological pattern.
