Figure 6.

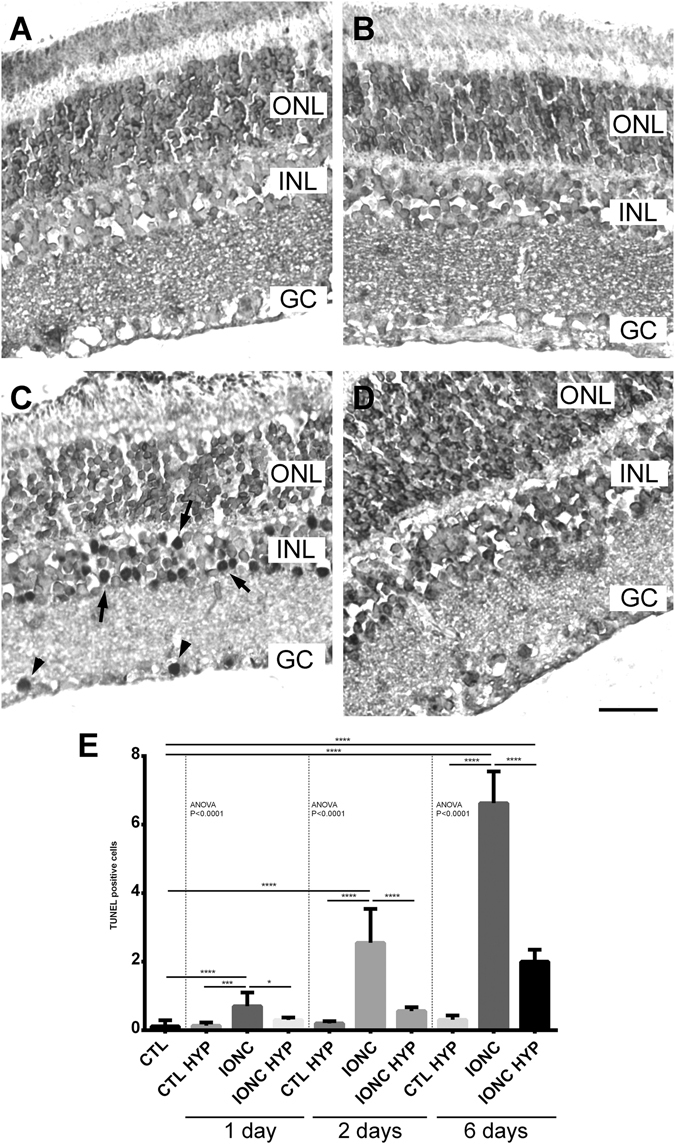
TUNEL positive cells in the 4 experimental groups 6 days post surgery. Representative images of retinas from sham-operated (A), sham-operated treated with hypothermia (B), IONC-operated (C), and IONC-operated rats treated with hypothermia (D). TUNEL positive cells were found mainly in the ganglion cell (GC) layer (arrowheads) and in the inner nuclear layer (INL, arrows). ONL: outer nuclear layer. Bar = 50 µm. Quantification of the results at 3 time points after surgery are shown as histograms (E). Bars represent the mean ± SD of all samples (n = 5 per group). Asterisks represent statistically significant differences. *p < 0.05; ***p < 0.001; ****p < 0.0001.
