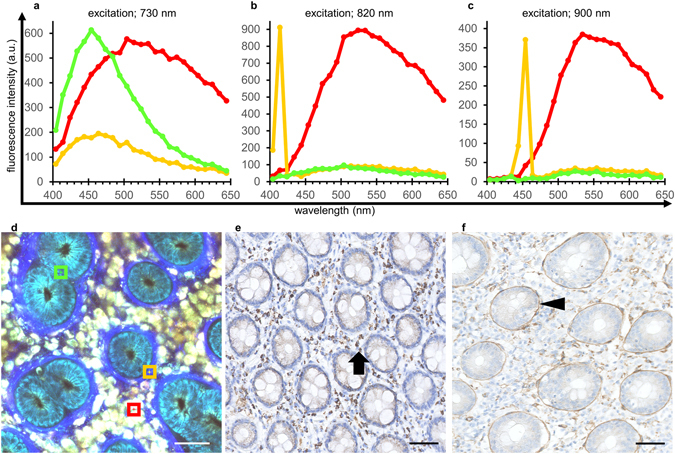
Figure 2.

Spectral analysis and immunohistochemical staining of normal colorectal mucosa. (a–d) Spectral analyses under excitation at 730 nm (a), 820 nm (b) and 900 nm (c) of the ROIs in the MPM image from normal colorectal mucosa (d). The green line is the spectrum of the epithelial cell region (green square ROI with a side length of 15 µm in (d)); red color indicates the immune cell region (red ROI); and the yellow color indicates the fibrous structure region (yellow ROI). (e) Immunohistochemical staining of normal colorectal mucosa using an anti-FAD antibody. Brown staining (FAD positivity) is distributed primarily in immune cells in the lamina propria (arrow). (f) Immunohistochemical staining using an anti-laminin antibody. The distribution of laminin-positive staining in the basement membrane (arrow head) is consistent with the fibrous structures observed by MPM imaging derived from SHG signals. Bar: 50 µm.
