Figure 5.

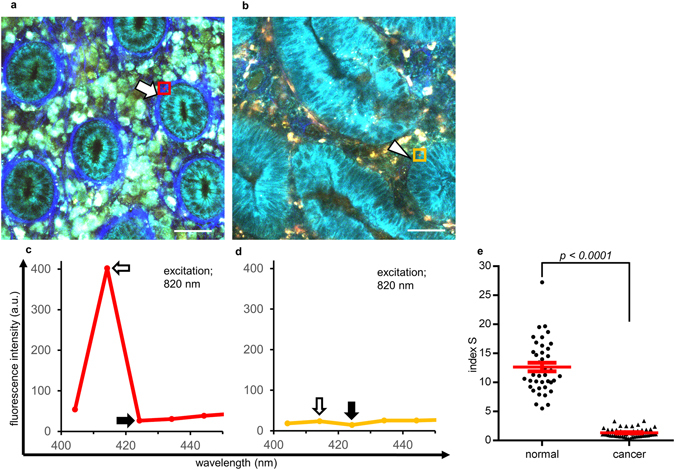
Evaluation of SHG signals from basement membranes with index S. (a,b) MPM images of normal colorectal mucosa (a) and cancer tissue (b). While the SHG signal was observed clearly in normal mucosa (arrow), regions in which the SHG signal was unclear or lost were observed in cancer lesions (arrow head). Bar: 50 µm. (c,d) Spectral analyses of regions with a clear SHG signal (c, red square ROI with a side length of 15 µm in (a)) and unclear signal (d, yellow ROI in (b)). Index S was calculated by dividing the fluorescence intensity at 410–420 nm (white arrow) by that at 420–430 nm (black arrow) in the square ROI under 820 nm excitation. (e) Index S of regions with a clear SHG signal in normal mucosa (left, n = 39) and unclear signal in cancer tissue (right, n = 51). Index S was calculated at three different regions per image in the spectral analysis. The red line indicates the mean ± SEM.
