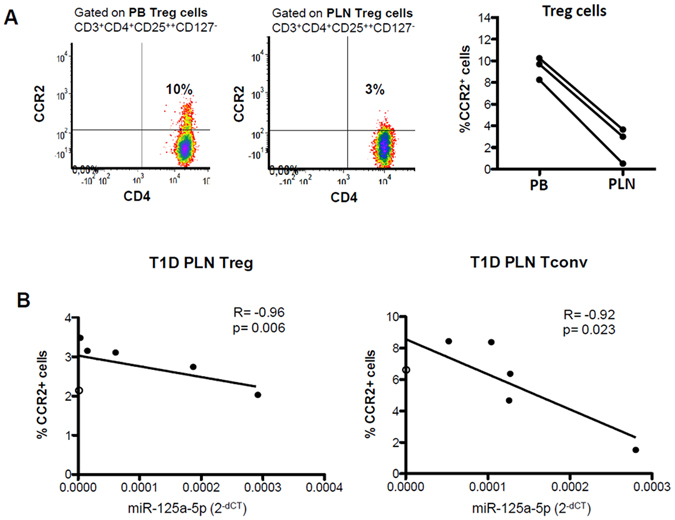
Figure 4.

(A) Representative flow cytometry dot plot showing CCR2 expression on Treg cells in peripheral blood (PB) and pancreatic lymph nodes (PLN) of a patient with T1D (left panel) and data collected in 3 patients with T1D (right panel). (B) Correlation analysis between percentages of CCR2+ cells in Treg cells (left panel) and Tconv cells (right panel) measured by flow cytometry and miR-125a-5p expression values measured as 2−dCT. Spearman R test was used.
