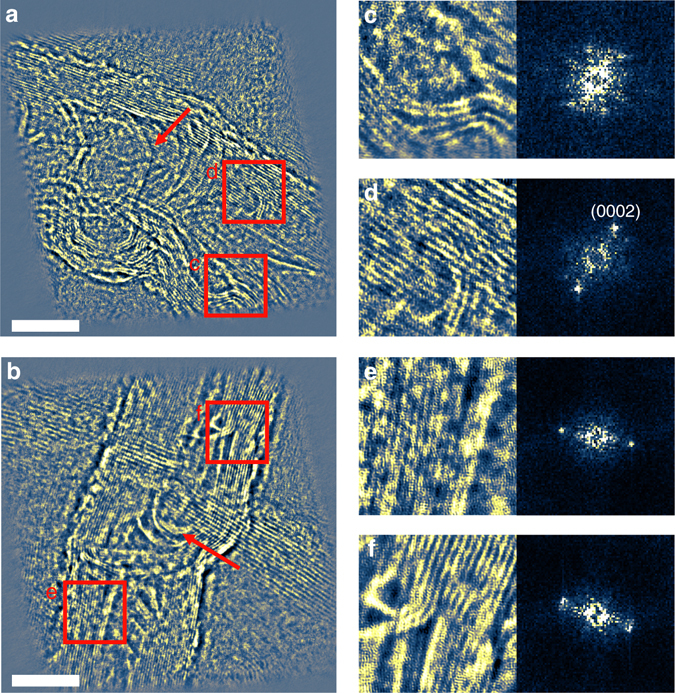
Fig. 3.

Reconstructed phase in focus. a, b Phase of the upper and lower CNTs at Gaussian focus, respectively. c–f Magnified views of regions indicated in a and b together with calculated power spectra. A lattice spacing of 0.34 nm in both CNTs is evident in both image and spectrum. Arrows indicate the compartment layers of the interior tube. Pixel size is 17 pm and the image size of a and b is 2400 × 2400 pixels. The 10 nm scale bar is the same for a–b
