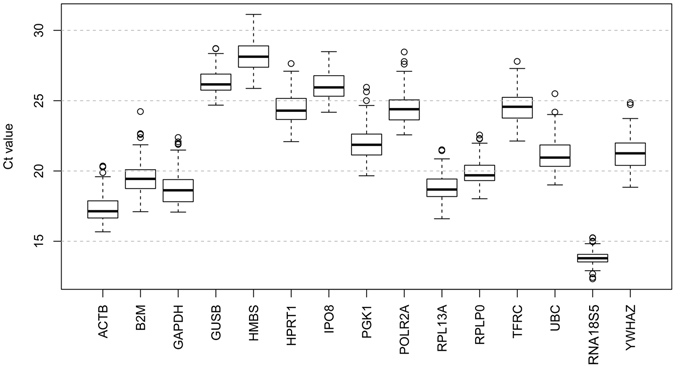
Figure 1.

Distribution of threshold cycle (Ct) values for the 15 candidate reference genes. Box-and-whisker plots showing the range of Ct values for each reference gene. The black center line indicates the median Ct. The extended upper and lower hinges indicate 75th and 25th percentiles. The whiskers indicate the largest or smallest Ct values falling within 1.5 times the interquartile range from the upper and lower hinges. Small circles indicate the outliers.
