Figure 3.

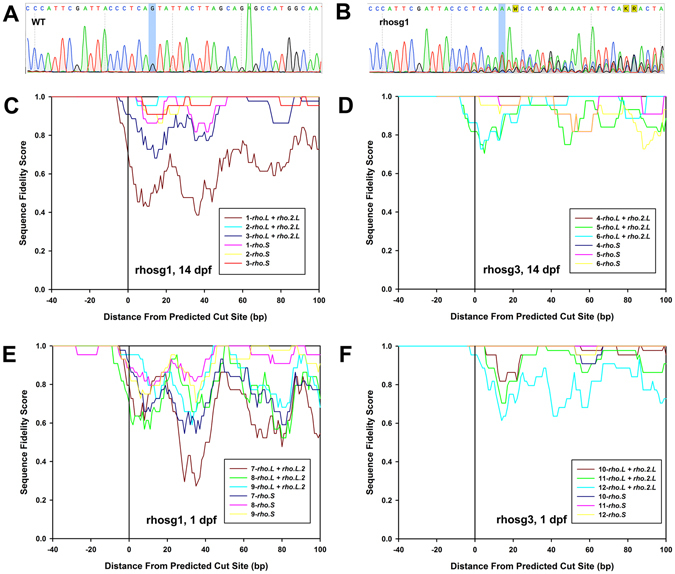
Indels are present in the genomic DNA of F0 animals. (A,B) Sample trace reads from dye-termination Sanger sequencing. (A) WT sample. (B) Edited with rhosg1. Cleavage is predicted to occur after the nucleotide highlighted in blue (numbered “zero” on plots below). (C–F) Comparisons of gene editing efficiency between guide RNAs, genes, and stage of development. Calculation of the sequence fidelity score is described under Methods. Each plot shows data derived from three animals, numbered 1–3, 4–6, 7–9 and 10–12.
