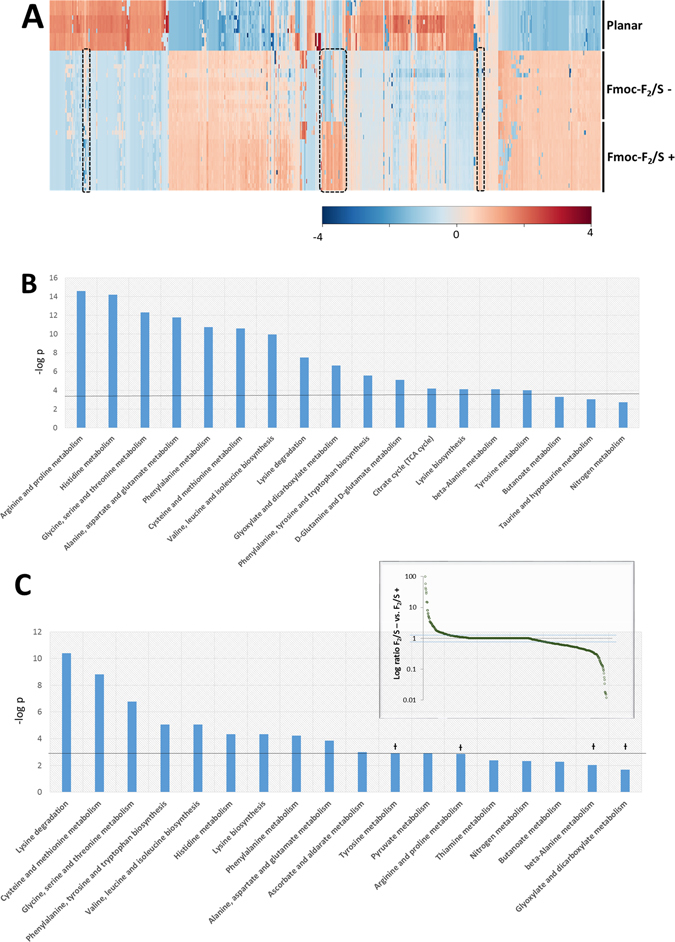
Figure 5.

Analysis of metabolite masses detected from pericyte cell extracts undergoing chondrogenesis (n ≥ 12). (A) Hierarchical cluster analysis of metabolic MS masses detected using LC-MS for pericytes cultured on planar substrates (undifferentiated) and cultured in Fmoc-F2/S in the presence or absence of chondrogenic induction media 35 days. (B) Metabolites were mapped to metabolic pathways to ascertain which cell processes are significantly changed from the control. (C) Comparisons between Fmoc-F2/S− and Fmoc-F2/S+ isolate metabolite masses that differ between the two by more than two fold (inset) giving insight into processes that lead to the altered chondrocyte phenotype between Fmoc-F2/S− and Fmoc-F2/S+ Pathways marked with Ɨ were observed to be significantly different from undifferentiated cells but not between Fmoc-F2/S− and Fmoc-F2/S+ suggesting influence during chondrogenesis but do not contribute to the observed differences in chondrocyte phenotype.
