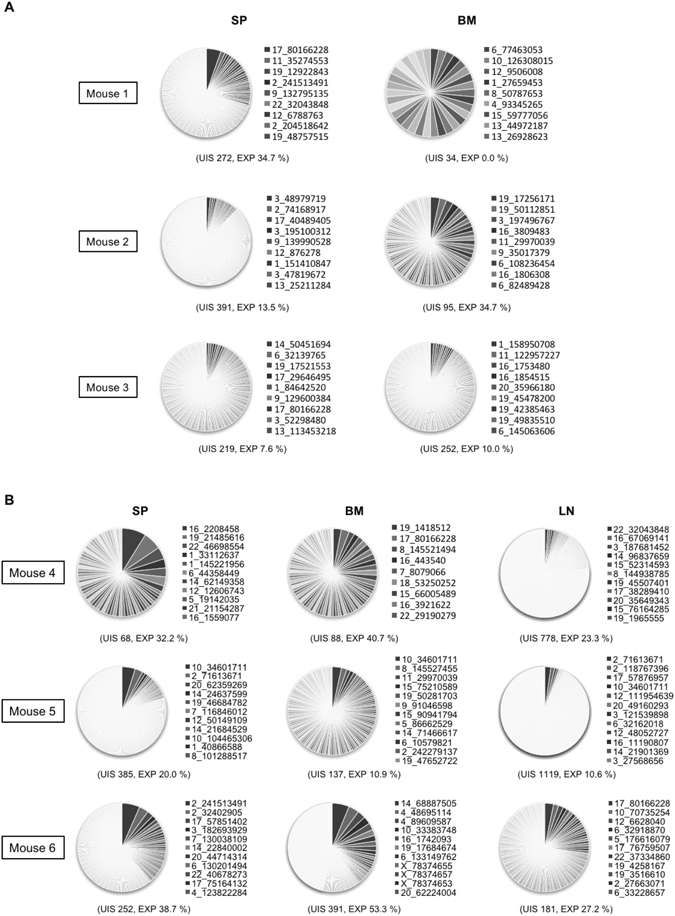
Figure 3.

Degree of clonal expansion of HIV-1-infected cells in individual mice. (A,B) Each pie chart graph shows the relative abundance of each individual clone in 2 wpi (A) and 15 wpi (B) mice. The area represents the relative degree of expansion of each individual clone in the tissue sample. DNA samples were analysed according to the experimental procedure shown in Supplementary Figure S1 and described in Methods. UIS: Number of unique integration site, EXP: % of expanded clone. A list of integration sites of the highly-expanded clones is shown on the right side of the pie chart as chromosome, positions.
