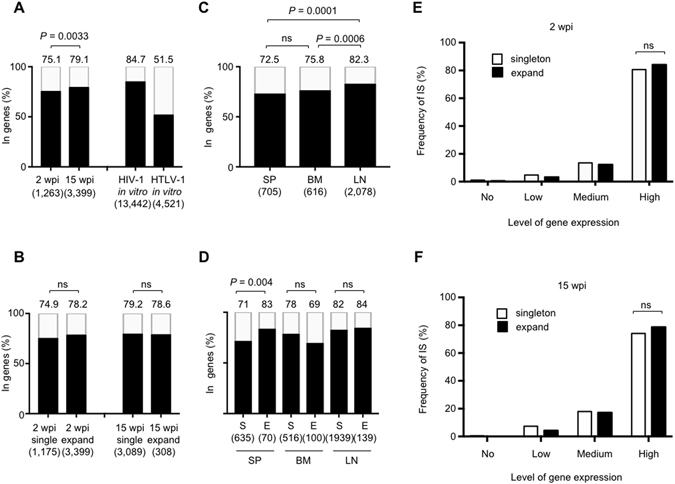
Figure 4.

Relationship between HIV-1 integration sites and the host genes. (A) Frequencies of the integration sites located in genes in 2 wpi or 15 wpi mice are shown in the bar graph. Jurkat cells infected with HIV-1 or HTLV-1 in vitro were used as controls. (B) Comparison of the frequency of expanded and singleton clone in 2wpi and 15 wpi mice. (C) Frequencies of integration sites within genes are shown for different tissues. (D) Comparison of the frequency between expanded and singleton clones in different tissues. S: singleton clones, E: expanded clones. Numbers above the graph indicate the percentage. The number of infected cells or clones in each sample is shown under the graph. (E,F) Relationship between integration sites and level of expression of the corresponding host genes in 2 and 15 wpi mice. The cumulative results from different tissues of 2 wpi mice (E) and 15 wpi mice (F) are shown in the bar graphs. ns: no significant difference.
