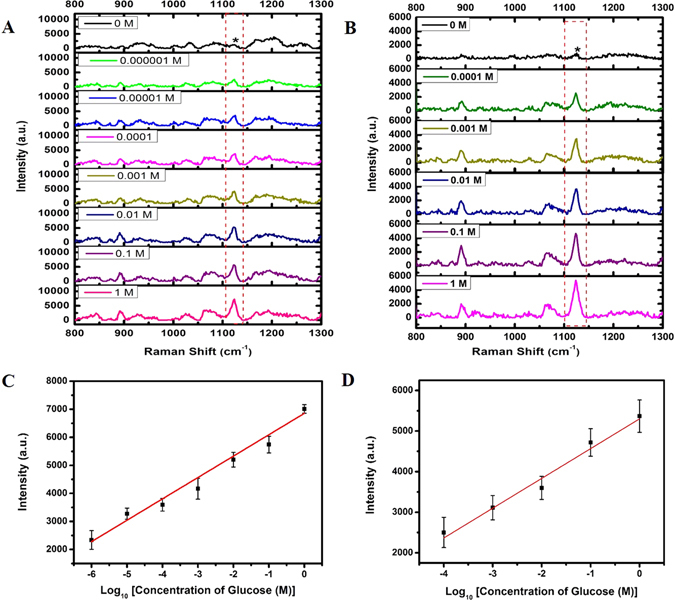
Figure 5.

Representative SERS spectra of the aqueous glucose solution mixed with dried 1-DT-modified (A) Ag NP@N-GQD (freshly made) and (B) Ag NPs (freshly made) on the surface of a clean aluminum foil, respectively. The excitation wavelength was 785 nm with a power density of 9.09 W/mm2 and an exposure time of 5000 ms. SERS intensity for the peak at 1123 cm−1 of the (C) Ag NP@N-GQD and (D) Ag NPs dependence on the concentration of glucose with the range of (10−6 to 1 M) and (10−4 to 1 M), respectively. Each data point represents the average value from five SERS spectra measured from different locations. Error bars indicate the standard deviations.
