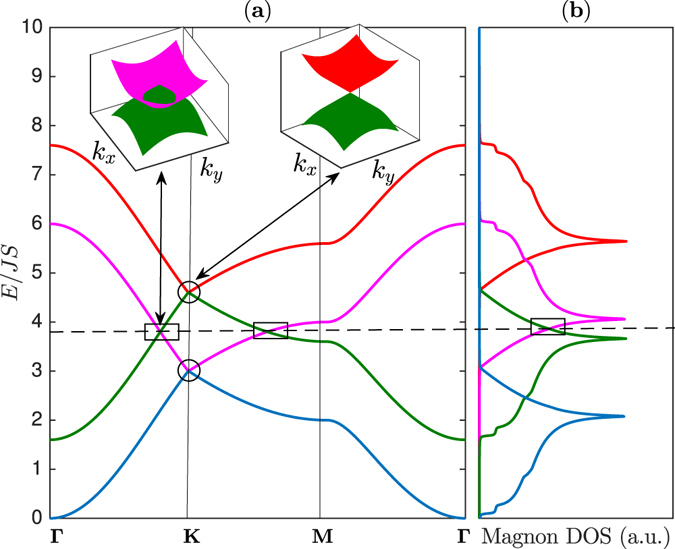
Figure 2.

The magnon energy bands and magnon density of states (DOS). (a) Magnon band structures with coexistence of magnon Dirac-nodal lines (rectangular boxes) and magnon Dirac points (circles) along the Brillouin zone paths in Fig. 1(b). The dashed line corresponds to the energy of Dirac magnon-nodal lines at E = E 0. The inset shows the 3D bands near K for the Dirac magnon-nodal lines and Dirac magnon points respectively as indicated by the same colour codes of the 2D bands. (b) The corresponding magnon density of states (DOS). The plots are generated by setting J L = 0.8 J.
