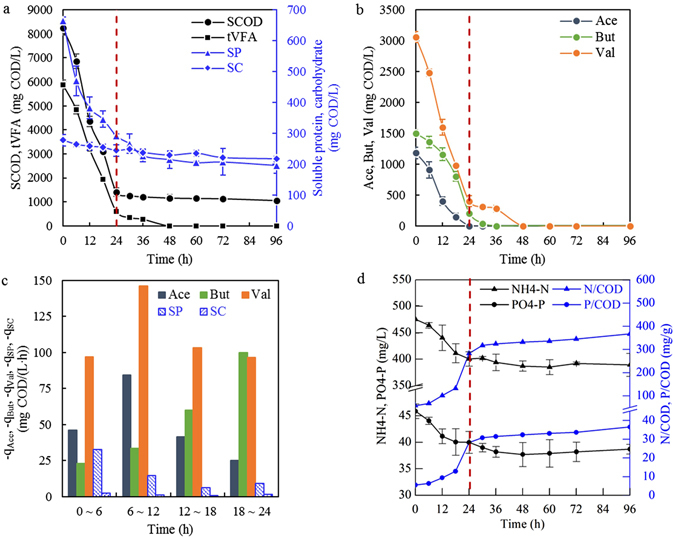
Figure 1.

Profiles of SCOD, total VFAs, soluble proteins and carbohydrates (a), main VFAs (b), their uptake rates (c), and nutrients utilization (d) during one cycle in the SBR operated under stability. Red dashed lines mark the end of feast phase. The uptake rate represents the average for the marked period. ‘tVFA’: total VFAs, ‘Ace’: acetate, ‘But’: butyrate, ‘Val’: valerate, ‘SP’: soluble proteins, ‘SC’: soluble carbohydrates. (bars = S.D., n = 3).
