
Figure 3.
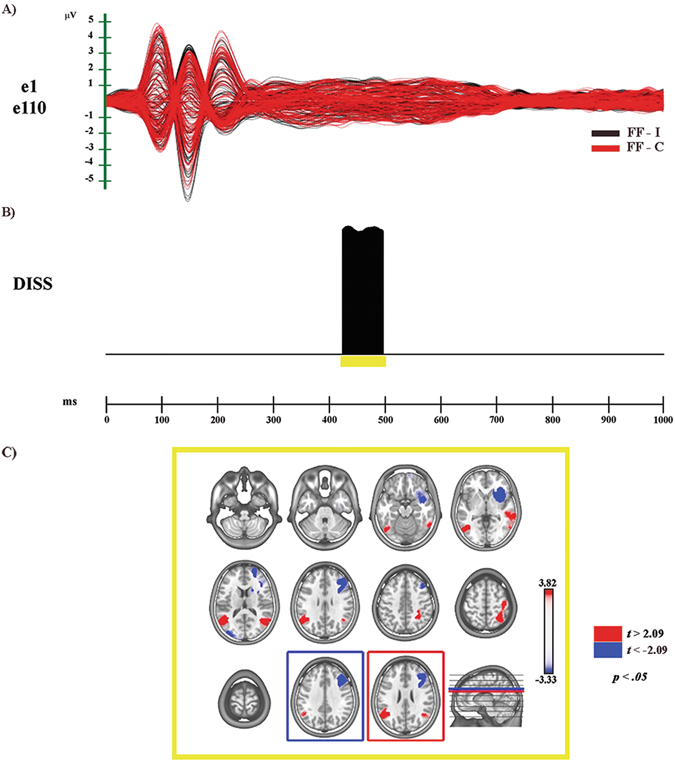
Electrophysiological results and statistical comparison of LAURA source estimations between FF-I and FF-C over significant TANOVA time interval (N400). (A) Group-averaged (n = 20) event related potential (ERP) waveforms of the two experimental conditions (FF-C and FF-I), superimposed across the 110 recording channels (e1–e110). Black: FF-I; red: FF-C. (B) Global scalp electric field analyses: statistical analysis of global electric field topography (topographic analysis of variance, TANOVA). Black area indicates time interval of significant differences (p < 0.05; duration ≥20 ms) of global spatial dissimilarity index (DISS). (C) Significant TANOVA time interval (424–496 ms after S2 onset). All significant voxels are colored (t (19) > 2.09/< −2.09, p < 0.05): positive t values (red color) indicate higher current source densities in FF-I than in FF-C; negative t values (blue color) indicate higher current source densities in FF-C than in FF-I. LAURA solutions are rendered on MNI152 template brain (left hemisphere on the left side).