Figure 5.

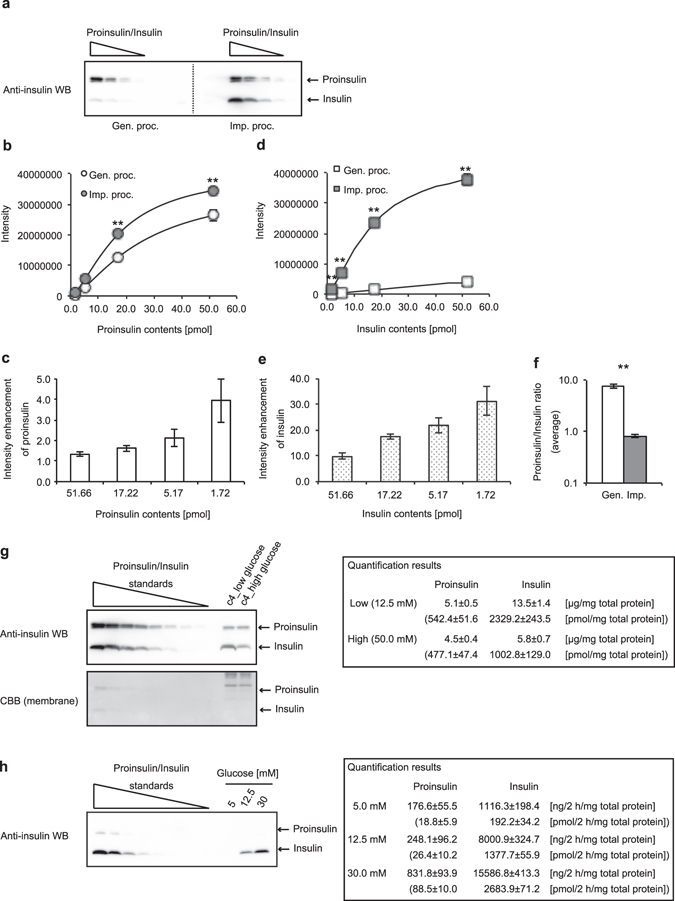
Quantification of insulin contents of a mouse β cell line MIN6c4. Dilution series of equal moles of proinsulin and insulin (range, 51.7 to 1.7 pmol) were subjected to the general (Gen.) or the improved (Imp.) Western blotting (WB) procedure (proc.). The blotted slips for the general or improved protocol were separated from one blotted membrane. (a) A representative image from four independent experiments is shown. (b–e) The quantification results of proinsulin (b and c) and insulin (d and e) were obtained from each of the four slips. The data are shown as mean ± S.E. and were analyzed with a Student t-test (**p < 0.01). The calibration curves were obtained by four-parameter logistic fitting methods (b and d). At each four-plotted point quantified, the enhancement of proinsulin or insulin intensity from the improved procedure against that from the general procedure is shown (c and e). (f) Proinsulin/insulin molar ratios (PI/I ratios) obtained from the general or improved WB are shown as the average from a PI/I ratio at each dose quantified. The data are shown as mean ± S.E. and were analyzed with a Student t-test (**p < 0.01). (g) Proinsulin and insulin contents of MIN6c4 cultured under the indicated conditions were calculated from the reference curve (dose range, 51.7 to 0.8 pmol) (n = 4). (h) Proinsulin and insulin contents secreted from MIN6c4 cells under the indicated conditions were calculated from the reference curve (dose ranges: proinsulin, 215.2 to 3.4 fmol; insulin, 2152.4 to 33.6 fmol) (n = 4).
