
Figure 3.
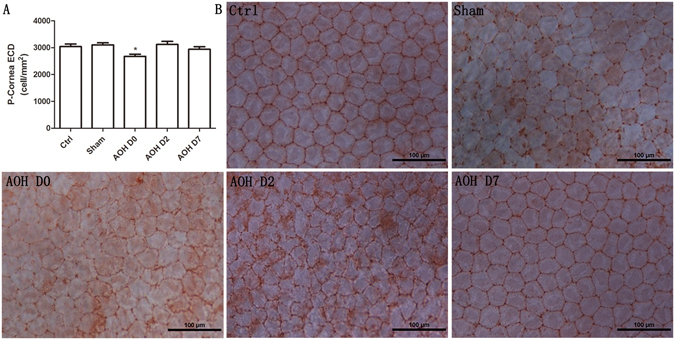
Peripheral CEC density quantification and histology. AOH decreased the peripheral corneal ECD (P < 0.05, Dunnett’s test) (A). Alizarin red staining revealed the CEC morphology (B). Normal CECs had a regular hexagonal morphology. Rapidly after irrigation, the morphology of CECs became irregular and multiform. Although the peripheral ECD increased to a normal level, the morphology was still not uniform after two days, whereas the morphology and size of the CECs had completely reversed to the normal condition after 7 days.