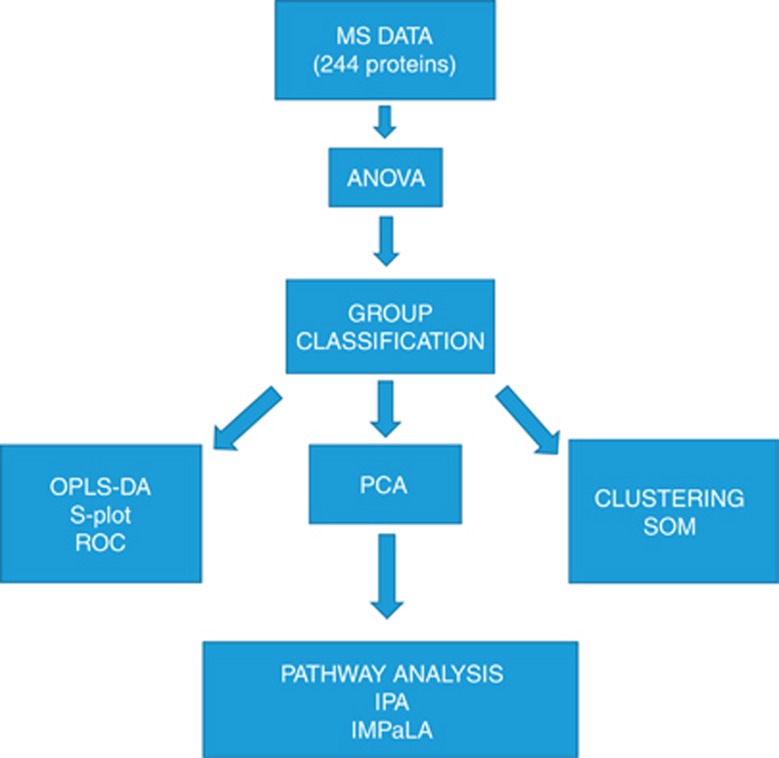
Figure 1.
Data analysis workflow. MS, mass spectrometry. ANOVA: a test taking into account the mean difference, variance and the sample size was used. A general cutoff of.05 was used. PCA: analysis to determine and visualise the principal axes of protein abundance variation in cases and controls. The idea of using this biplot is to distinguish how much variation the classes of samples have when compared to one another and make it easily visible. OPLS-DA: a statistical method to find the predictive variance in comparison between cases and controls. OPLS-DA generates a S-Plot where x axis shows the magnitude of difference in particular protein abundance and y axis the significance of that protein in comparison of the two groups. A binary classification system called ROC analysis was used to further validate the S-Plot proteins by calculating AUC values. These predict which proteins selected by S-Plot also act as classifiers in ROC curve analysis. Clustering: serves as an alternative technique to analyse the difference between cases and controls. Self-organising maps (SOMs) is a data visualisation technique that reduces the dimensions of data through the use of self-organising neural networks. The results of SOM clustering methods are often visualised by a heat map. SOM belongs to unsupervised clustering. Pathway analysis: shows the enriched pathways among the proteins overexpressed in cases and controls. IPA and IMPaLA are two independent methods for this kind of analysis.

