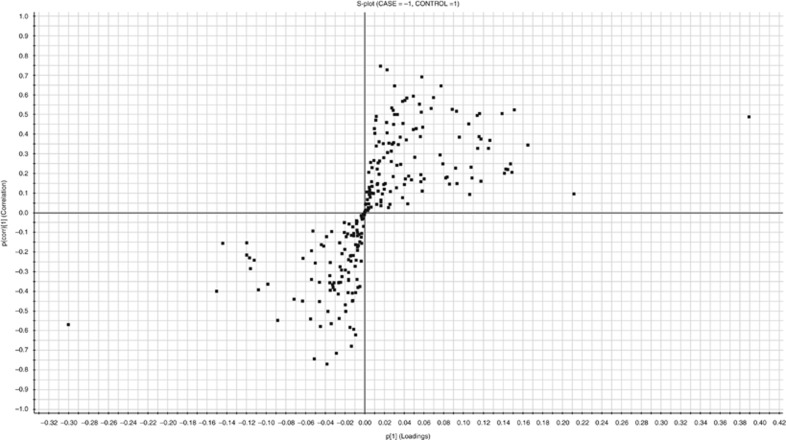
Figure 3.
S-plot of the OSCC cases vs healthy controls. S-plot obtained from OPLS-DA regression analysis. Proteins with p(corr) value higher than +0.65 or lower than −0.65 are considered significantly different. At the upper right corner are the proteins downregulated in the OSCC patients’ (cases) serum and at the lower left corner proteins upregulated in these cases.

