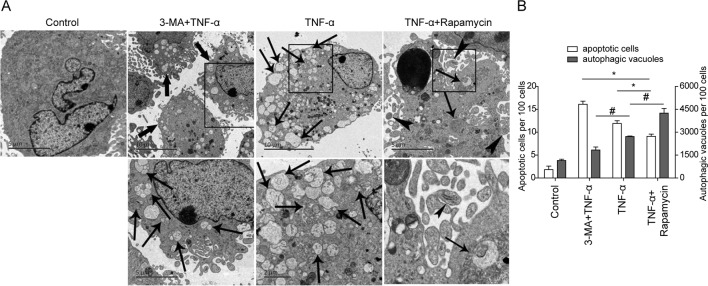
Figure 2.
Detection of autophagy and apoptosis in MC3T3-E1 cells by transmission electron microscopy (TEM). (A) MC3T3-E1 cells were treated vehicle control, tumor necrosis factor-α (TNF-α) (20 ng/mL, 48 hours), rapamycin+TNF-α (rapamycin, 500 ng/mL, 6 hours; TNF-α, 20 ng/mL, 48 hours) or 3-methyl adenine (3-MA)+TNF-α (3-MA, 10 nM, 12 hours; TNF-α, 20 ng/mL, 48 hours). In TNF-α-treated cells, both autophagic bodies (thin black arrow) and apoptotic cells (thick black arrow) could be detected. Co-treatment of rapamycin and TNF-α increased autophagic vacuoles and bodies (thin black arrow) significantly. In 3-MA+TNF-α-treated cells, increased apoptotic cells (arrow head), but decreased autophagic vacuoles (thin black arrow) were found. Boxed areas in black were magnified and shown in the lower panel. (B) Quantitative data of TEM. The number of autophagic bodies per 100 cells and number of apoptotic cells per 100 cells were presented. *p<0.05 versus corresponding control (apoptotic cells); # p<0.05 versus corresponding control (autophagic vacuoles).

