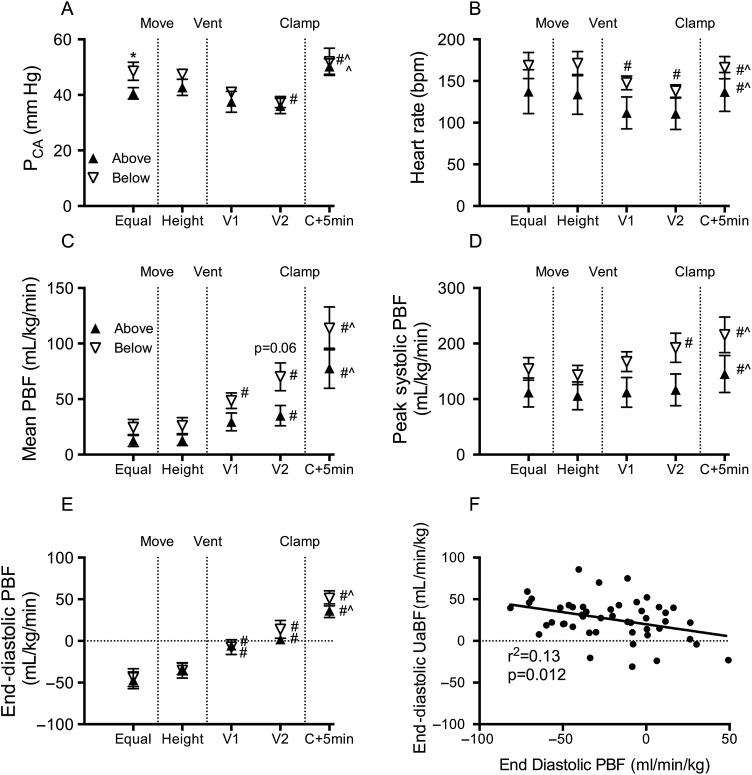
Figure 3.
Systemic and pulmonary haemodynamics. (A) Mean carotid arterial pressure (PCA), (B) heart rate, (C) mean pulmonary blood flow (PBF), (D) peak systolic PBF, (E) end-diastolic PBF and (F) correlation between end-diastolic umbilical arterial blood flow (UaBF) and end-diastolic PBF in lambs placed below (down arrows) or above (up arrows) the midline measured prior to moving (equal), when lambs height was adjusted (height), 1 (V1) and 2 (V2) minutes after ventilation onset and 5 min after umbilical cord clamping (C+5 min). *Indicates significant differences between groups (p<0.05). #Indicates significant time effect from control (equal) values. ^Significant time effect between ventilation (V2) and C+5 min.

