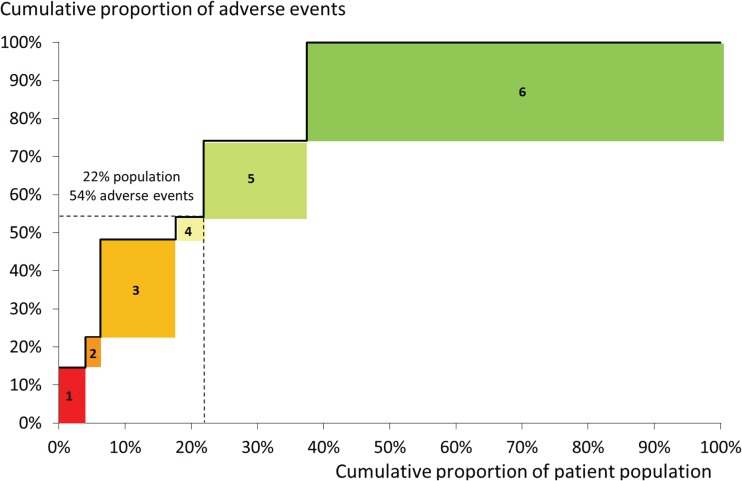
Figure 4.
Graphical data summary used to inform prioritisation of service improvements. A graphical data summary developed to inform the decision process of prioritising service improvements. The patient groups were developed using classification and regression tree analysis of linked national UK congenital heart disease and paediatric intensive care audit datasets (see57 for details). Groups are ordered from left to right in decreasing risk of adverse events (death or emergency readmission to paediatric intensive care within a year after discharge from infant cardiac surgery). This graph was used in a workshop to guide the Working Group's discussions about targeting interventions at patient groups. When used in the workshop, a detailed key was included to describe the specific clinical features of each group (see57 for further details).

