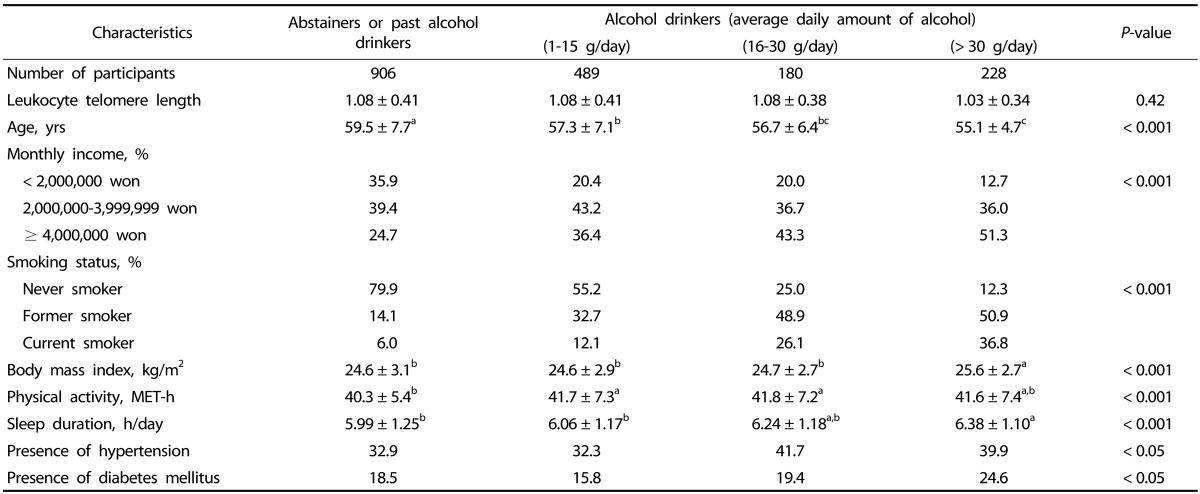
Table 1. Characteristics of 1,803 study participants according to alcohol consumption status.
MET-h: metabolic equivalents
Data are presented as mean ± standard deviation or as proportion.
P-value from chi-squared test or analysis of variance
Different letters indicate significant differences between groups (Scheffé post hoc test, P < 0.05).

