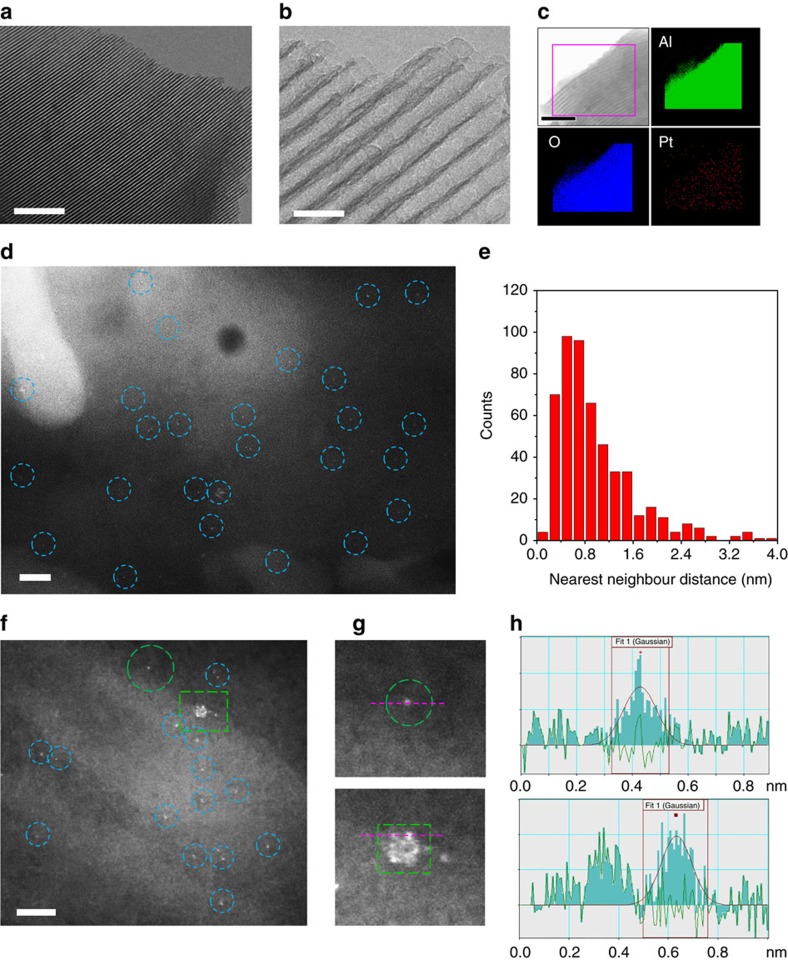
Figure 2. Characterization of single-atom Pt materials.
For 0.2Pt/m-Al2O3-H2, (a,b) TEM, (c) TEM-EDS elemental mapping, (d) HAADF-STEM image, (e) the number of atoms for the nearest neighbour distance from 532 single atoms (representative images were shown in Supplementary Fig. 8). For 0.2Pt/m-Al2O3-O2, (f) an HAADF-STEM image, (g) the circle and square regions with the same colour and shape from f, (h) line-scanning intensity profiles obtained on the two zoomed areas in g. Scale bar, 200 nm (a), 20 nm (b), 100 nm (c), 2 nm (d), 2 nm (f).

