
Fig. 1.
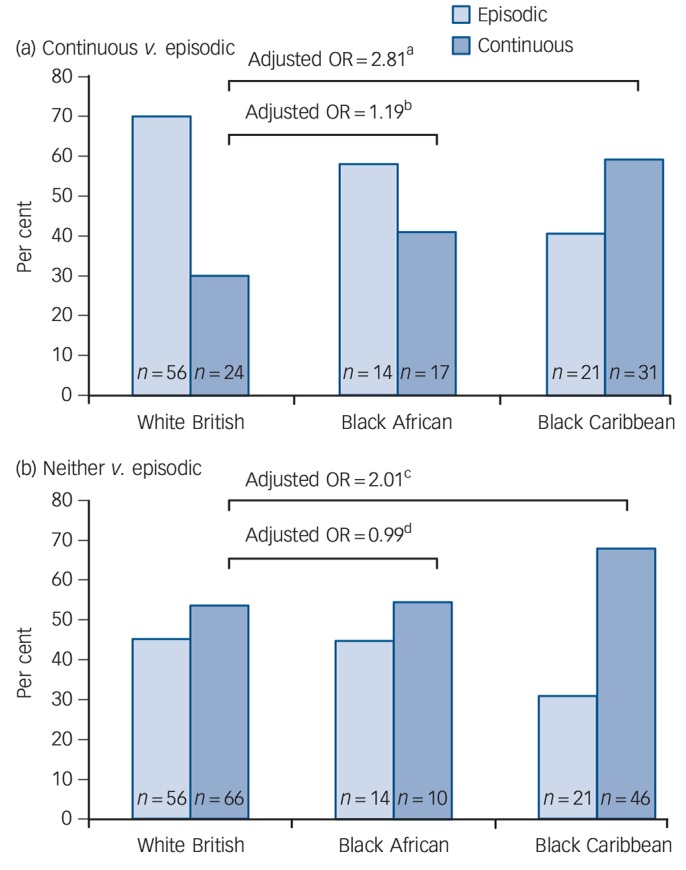
Course type by ethnic group.
Odds ratios adjusted for study centre, age, gender and baseline diagnosis, a. 95% CI 1.15–6.92, P = 0.024; b. 95% CI 0.39–3.68, P = 0.760; c. 95% CI 0.92–4.36, P = 0.079; d. 95% CI 0.38–2.57, P = 0.980.
Official websites use .gov
A
.gov website belongs to an official
government organization in the United States.
Secure .gov websites use HTTPS
A lock (
) or https:// means you've safely
connected to the .gov website. Share sensitive
information only on official, secure websites.
Course type by ethnic group.
Odds ratios adjusted for study centre, age, gender and baseline diagnosis, a. 95% CI 1.15–6.92, P = 0.024; b. 95% CI 0.39–3.68, P = 0.760; c. 95% CI 0.92–4.36, P = 0.079; d. 95% CI 0.38–2.57, P = 0.980.