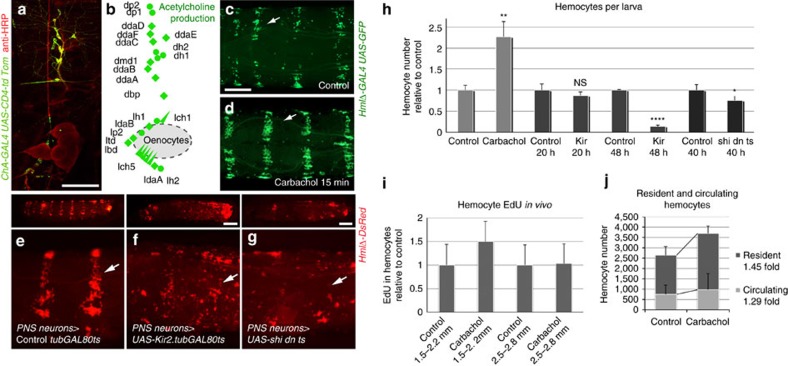
Figure 5. PNS neuron activation promotes hemocyte recruitment and proliferation.
(a) Labelling of cholinergic PNS neurons using the diagnostic driver Cha-GAL4 x UAS-CD4-td Tom and anti-HRP 488; false colouring of ChA positive neurons in green, HRP in red. (b) Model, Cha-GAL4 positive signal in all PNS neurons. (c,d) Stimulation of PNS neurons. Live imaging of larvae marked with HmlΔ-GAL4, UAS-EGFP, dorsal view. (c) Control; (d) carbachol, short-term exposure (10 mgml−1, 15 min). (e–g) Live imaging of hemocytes (HmlΔ-DsRed, red) after transient disturbance of electrochemical signalling in PNS neurons, hemocytes in red; arrows point to HPs. Larvae lateral view (top panels), closeups (lower panels). (e) Control, 21-7 GAL4, UAS-mCD8GFP, HmlΔ-DsRed/+; (f) Kir2.1 expression to hyperpolarize neurons, 21-7 GAL4, UAS-mCD8GFP, HmlΔ-DsRed/ tubGAL80ts; UAS-Kir2.1/+; (g) Expression of UAS-shi dnts in neurons, 21-7 GAL4, UAS-mCD8GFP, HmlΔ-DsRed/+; UAS-shi dnts/+. (h) Larvae −/+ carbachol exposed from hatching onward, and larvae −/+ genetic neuronal silencing as in (f) and (g), heats shocks to induce transgenes were applied as indicated; total hemocyte counts from single larvae (2nd instars, 66–78 h AEL corresponding to 2.3–2.7 mm). For each experimental cohort, total hemocyte numbers of experiment sets relative to side-by-side control sets of larvae are shown; n=3 to 5 and comparable effect in independent repeats. (i) In vivo EdU incorporation of hemocytes from larvae exposed to −/+ carbachol (0.7 mg ml−1) from 1st instar (∼22 h AEL) onward. Genotype is HmlΔ-GAL4, UAS-GFP; He-GAL4; larval sizes as indicated, corresponding to 2nd instar 47–65 h AEL (1.5–2.2 mm) and 72–80 h AEL (2.5–2.8 mm). EdU incorporation of experiment sets relative to side-by-side control sets of larvae are shown; average of three independent experiments, total n=6 to 9 per condition. (j) Fraction of resident and circulating hemocytes of −/+ carbachol treated larvae 74–85 h AEL (2.6–3.0 mm), on carbachol (0.7 mg ml−1) since first instar (∼22 h AEL); genotype HmlΔ-GAL4, UAS-GFP; He-GAL4. Carbachol treated animals show a larger increase in the resident than in the circulating population (1.45 fold versus 1.29 fold); n=13 to 14 per condition. Scale bars, a, 100 μm; c, 0.2 mm; and f,g, 0.5 mm. Error bars represent s.d., and two-tailed t-tests value correspond to NS (not significant) P>0.05; *P≤0.05; **P≤0.01; ***P≤0.001; ****P≤0.0001.

