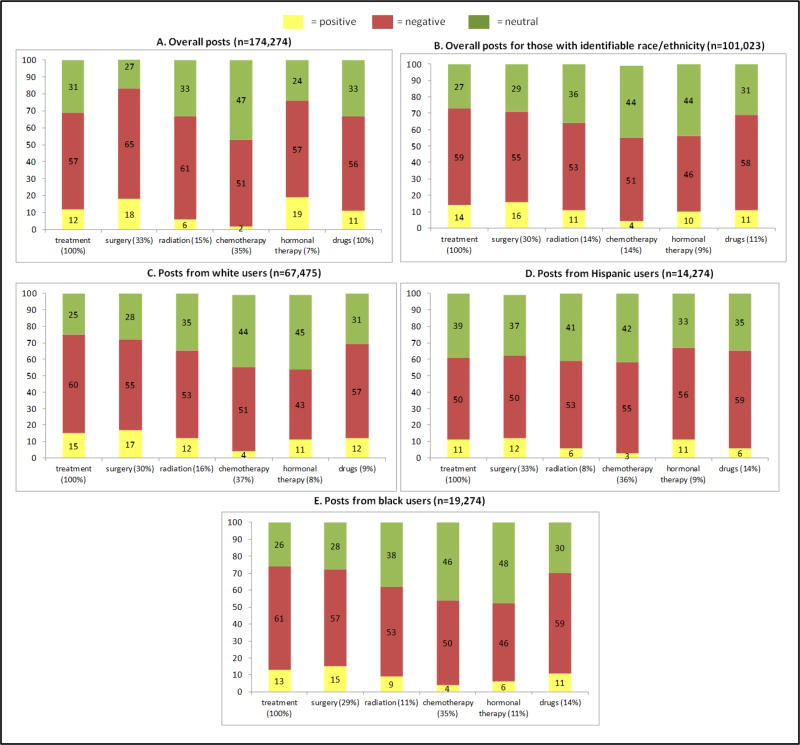
Figure 3. Percent of general sentiments (positive/negative/neutral) by treatment type [overall (3A, n=174,274 posts) and by race/ethnicity among the users for whom treatment type could be identified* (3B-3E [n=101,023 posts]).
*The percent under each treatment bar represents the percent of posts about treatment that were related to each component of therapy. The yellow, red, and green bars represent the proportion of sentiments that were positive, negative, and neutral, respectively.

