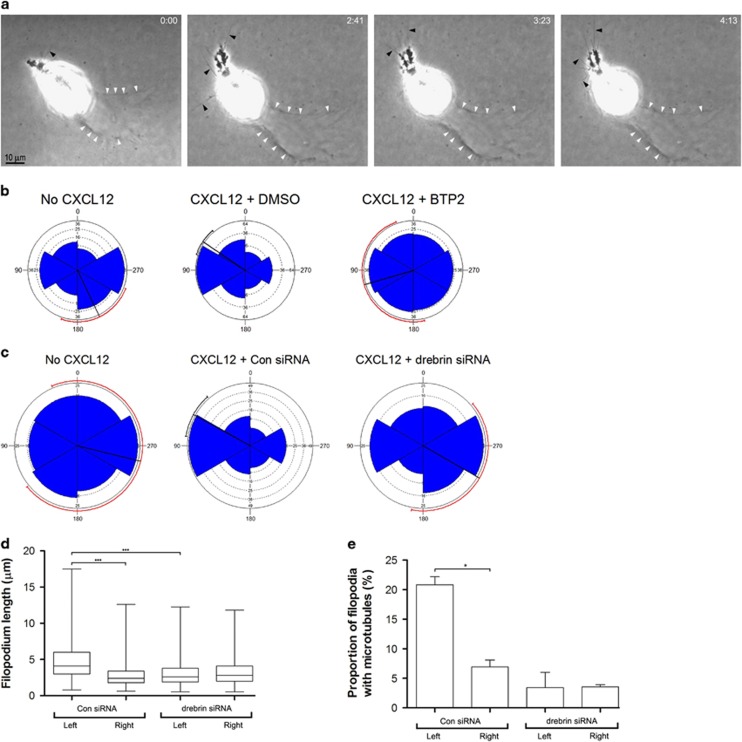
Figure 4.
Drebrin knockdown inhibits PC-3 cell invasion by attenuating polarization and the chemotactic response to a CXCL12 gradient. (a) Selected frames from phase contrast videos of PC-3 cells in Matrigel in chemotaxis chambers. The source of CXCL2 is to the left. After 48 h, PC-3 cells have become polarized, extending pseudopods with filopodia (arrowheads) and have oriented towards the CXCL12 gradient. The cell has moved across the field from right to left, as indicated by a trail of degraded Matrigel (white arrowheads). Elapsed time in hours and minutes is indicated in the top right-hand corner. (b, c) Polar plots showing the invasive response of PC-3 cells to a gradient of CXCL12 in 3D Matrigel culture. Cells were treated with: (b) vehicle (DMSO) or 5 μM BTP2, or (c) drebrin siRNA or control siRNA (Con siRNA) and cultured in Matrigel in chemotaxis chambers with or without a CXCL12 gradient. The source of CXCL12 is to the left. The orientation of degradation trails with respect to the gradient of CXCL12 was recorded after 48 h in culture. At least 20 cells were counted from each condition in each of three independent experiments. The radial black line shows the mean for the data and the circumferential line the 95% tolerance limits. A red circumferential line indicates that the confidence limits are unreliable. (d) Filopodia length of rounded PC-3 cells transfected with control siRNA (Con siRNA) or drebrin siRNA in 3D Matrigel in a concentration gradient of CXCL12 at 24 h. Filopodia lengths on the gradient-facing, left side of the cell were compared with those on the opposite, right side of the cell. Numbers are for three independent experiments. The filopodia of at least five cells were counted from each condition in each experiment. Significant difference: ***P<0.001. (e) Proportion of filopodia containing dynamic microtubules in rounded PC-3 cells transfected with control siRNA (Con siRNA) or drebrin siRNA in 3D Matrigel in a concentration gradient of CXCL12 at 24 h. Filopodia on the gradient-facing, left side of the cell were compared with those on the opposite, right side of the cell. Numbers are mean±s.e.m. for two independent experiments. The filopodia of at least 10 cells were counted from each condition in each experiment. Significant difference: *P<0.05.

