Figure 5.
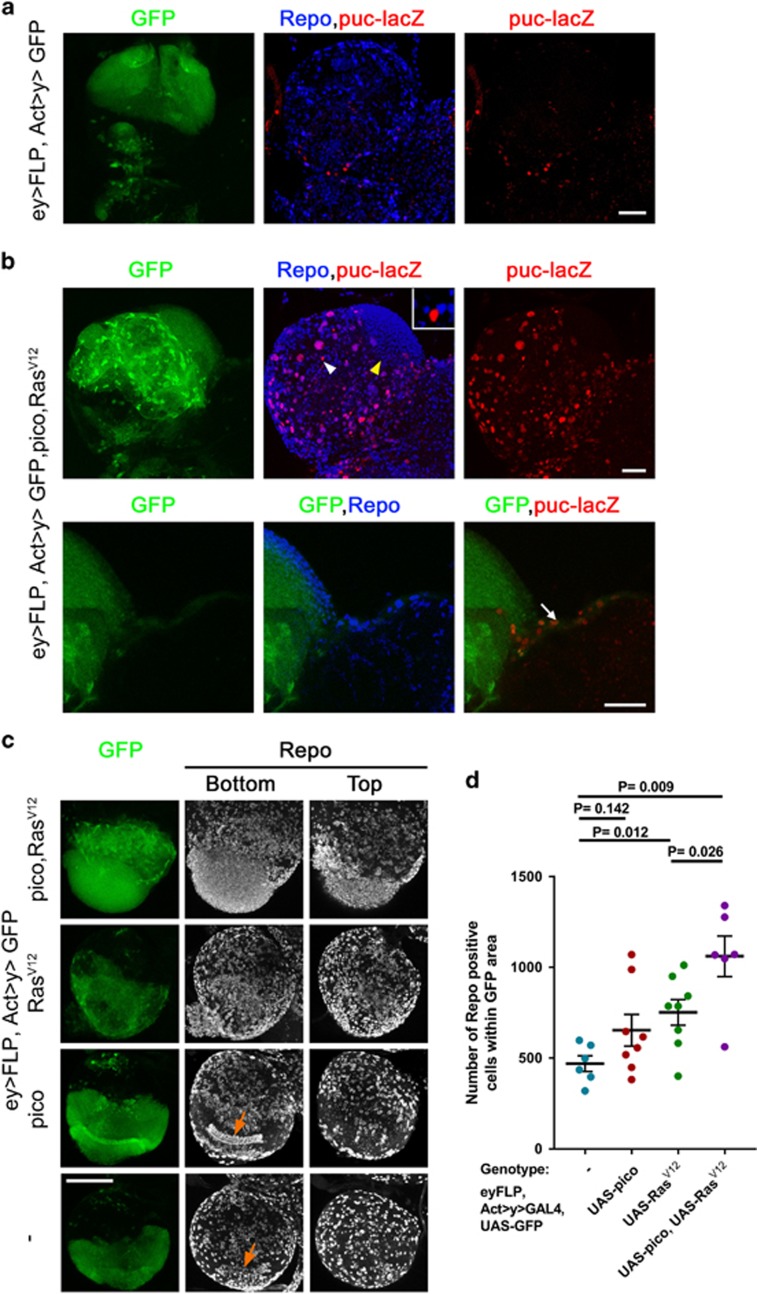
Distinct oncogenic effects in glial populations. (a, b) Optic lobes from third instar larvae, orientated with the VNC to the right of each image. GFP-expressing regions are in green, glia are marked with Repo in blue and JNK activation is marked with puc-lacZ in red. (a) GFP-only expressing control showing that reconstitution of Actin-GAL4 after flipping out an FRT-flanked linker with eyFLP drives GFP expression heritably in glial lineages marked with Repo, as well as other lineages. Some cells are also labelled with puc-lacZ, although the majority of these lie outside the GFP-labelled area. (b) Coexpression of RasV12 and pico results in two distinct effects observable in Repo +ve glia (top panels): activation of JNK, marked with puc-lacZ expression, and accumulation of glial cells in a region proximal to the VNC (yellow arrowhead), largely lacking puc-lacZ expression. Inset is a magnified image of a Repo –ve cell staining positive for puc-lacZ (white arrowhead). Magnified images (bottom) show a GFP and puc-lacZ labelled population that has invaded into the VNC (arrow). Scale bars, 50 μm. (c) Anti-Repo staining showing the effect of RasV12 and pico co-overexpression on glial distribution and number in optic lobes. Repo-stained images are 2D projections of confocal z-stacks from the bottom and top of the same optic lobe. Bottom sections reveal stereotypical arrangement of glia (arrows) in control optic lobes and those overexpressing pico, which is lost upon expression of RasV12. Scale bar, 100 μm. (d) Graph showing quantification of number of Repo-positive glia in GFP-labelled areas of the optic lobes from the indicated genotypes. Mean value of individual data points±SE is indicated.

