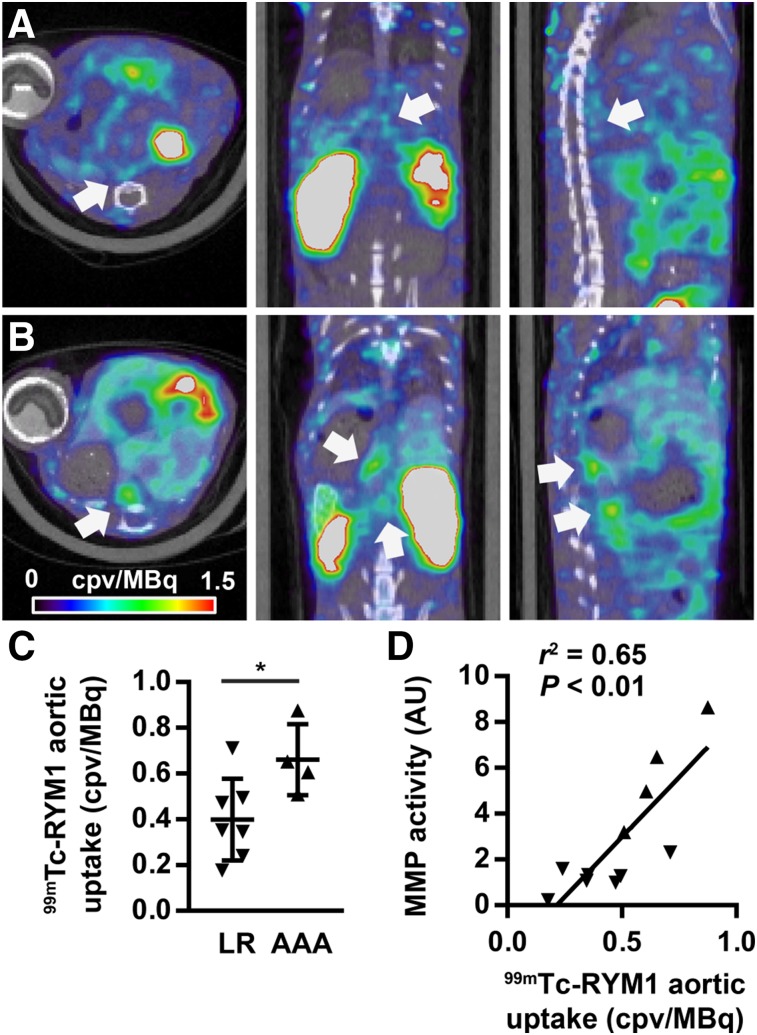
FIGURE 4.
99mTc-RYM1 imaging of AAA. (A and B) Examples of fused 99mTc-RYM1 SPECT/CT images of animals from the low remodeling (A) and aneurysm (B) groups, classified on the basis of visual in situ analysis of abdominal aorta. Transversal (left), coronal (middle), and sagittal (right) views are shown. Arrows point to areas of maximal tracer uptake in abdominal aorta. (C) Quantification of 99mTc-RYM1 signal in area of maximal tracer uptake in suprarenal abdominal aorta in low remodeling and AAA groups. *P < 0.05. (D) Correlation between 99mTc-RYM1 signal in vivo and MMP activity quantified by zymography ex vivo. AU = arbitrary units; cpv = counts per voxel; LR = low remodeling.

