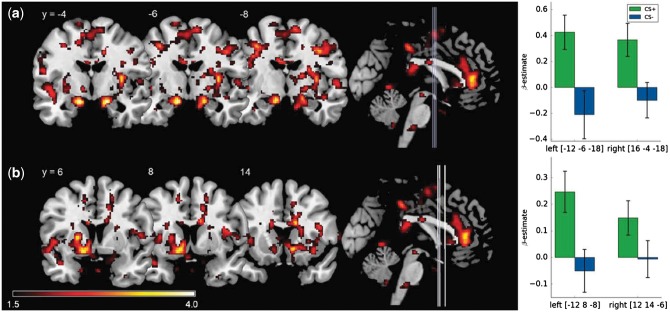
Fig. 4.
Significant ROI activations during the late phase of extinction (CS + late − CS − late) on voxel level P < 0.05 (FWE-corrected). (a) Bilateral activation of the amygdala and (b) bilateral activation of the NAcc. Lines on the sagittal slices on the right side indicate the coronal slices depicted on the left. Displayed t-values are thresholded at t < 1.5. (Right) Mean β-weights of the respective CS+ and CS− activations. All error bars indicate SEM.

