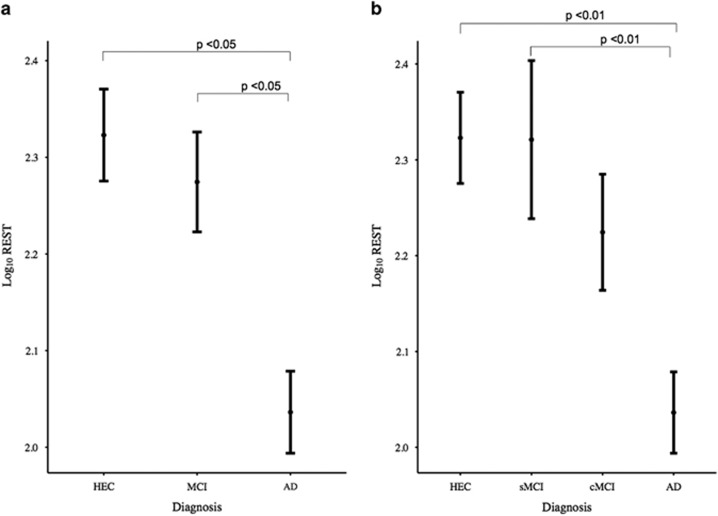
Figure 1.
Repressor element 1-silencing transcription (REST) values stratified by clinical diagnosis. Log10-transformed REST values (corrected for assay plate and center) are represented as means (s.e.m. error bars). (a) There was a significant decline in REST from healthy elderly controls (HEC) to mild cognitive impairment (MCI) to Alzheimer’s disease (AD). Compared with the AD group, the MCI group showed significantly higher levels of REST (+95.73, 95% CI 1.82–189.65, P=0.046) as did the control group (+122.45, 95% CI 27.96–216.93, P=0.011). (b) Dividing mild cognitive impairment groups into those who remained stable (sMCI) and those who later converted to AD (cMCI), compared with the AD group, REST levels were not significantly different in the cMCI group (26.00, 95% CI −90.67–142.68, P=0.66) but were significantly higher in the sMCI group (159.06, 95% CI 47.77–270.65, P=0.005) and controls (126.12, 95% CI 32.53–219.70, P=0.008).

