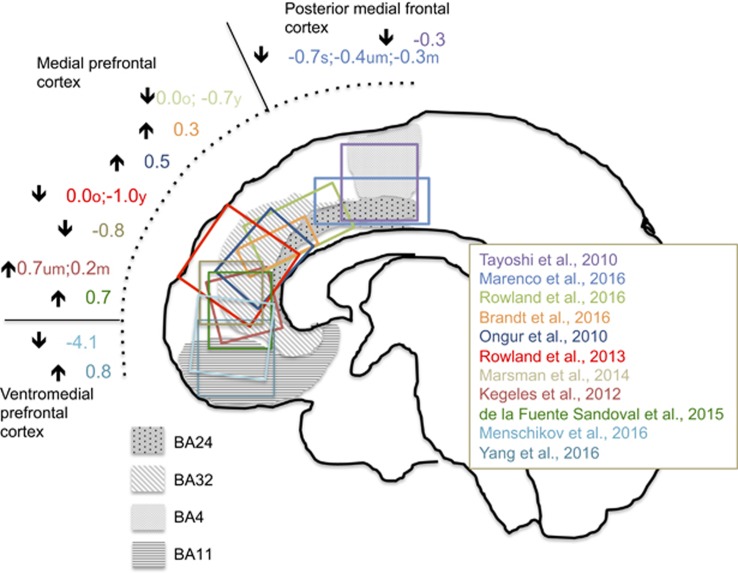
Figure 1.
Voxel locations in medial frontal cortex GABA 1H-MRS studies. Numbers provide effect sizes (Hedge’s g) for the difference in 1H-MRS GABA level between patients and control participants for each study. Negative effect sizes indicate lower GABA in patients; positive effect sizes indicate lower GABA in controls. Subgroup membership was defined by voxel locations primarily in the Brodmann Areas (BA) BA4 and BA24 (posterior medial frontal cortex), BA24 and BA32 (medial prefrontal cortex) or BA24 and BA11 (ventromedial prefrontal cortex). 1H-MRS, proton magnetic resonance spectroscopy.

