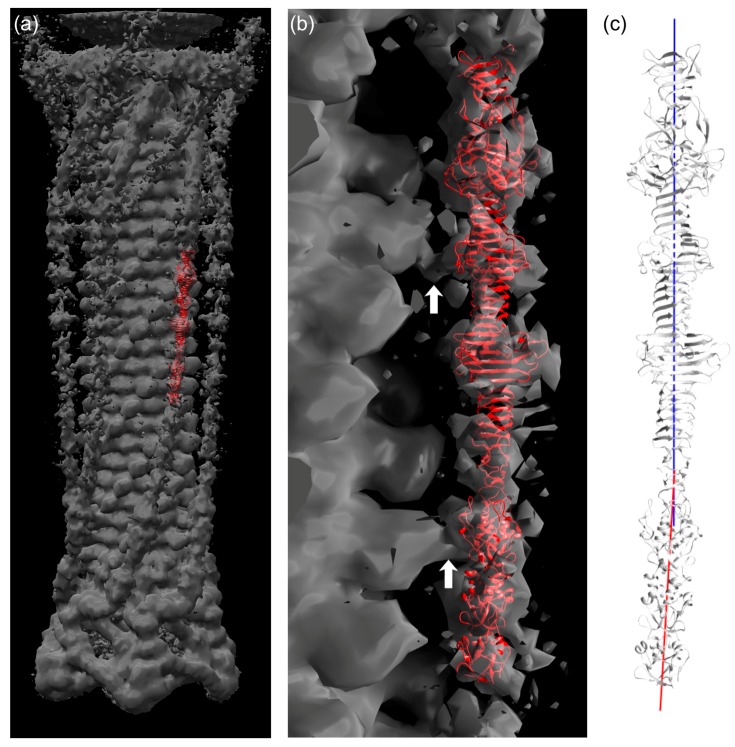
Figure 5.
Fitting of the gp34(744–1289) crystal structure in cryo-electron microscopy density of the bacteriophage T4 tail. (a) Crystal structure in red fitted into EM density of the T4 tail (EMD-1126, grey). (b) Close view of (a). White arrows indicate connected EM density between long tail fiber and phage sheath. (c) Representation of local three-fold axis of the C-terminal part (blue, 882–1289) and N-terminal part (red, 744–881).

