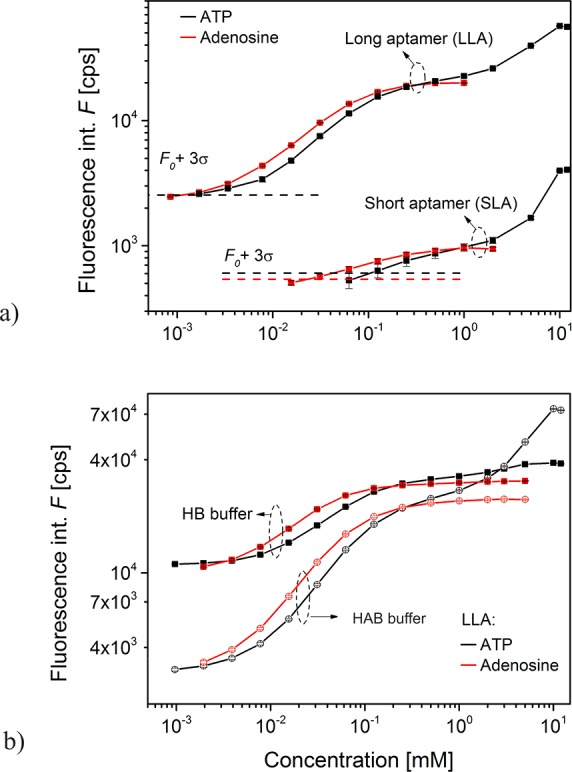
Figure 6.

Calibration curves measured with SPFS detection principle for ATP and adenosine analytes. Each data points (ΔF) derived from triplicate titration measurements (an example shown in Figure 4). (a) Comparison of the response for LLA and SLA aptamers and analyte dissolved in HAB buffer. (b) Comparison of the response for LLA aptamer and analytes dissolved in HAB and HB buffers.
