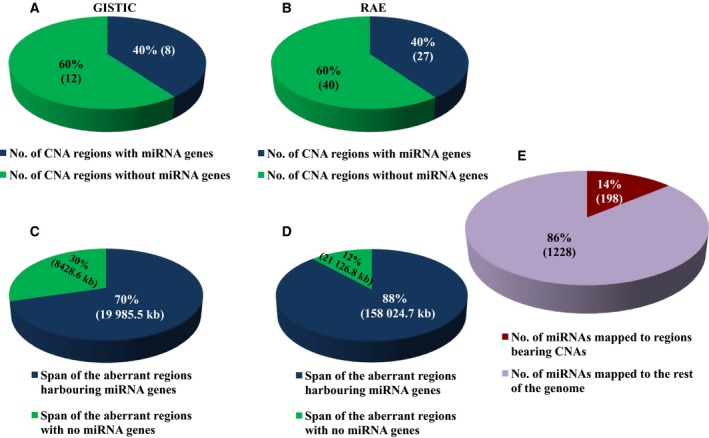
Figure 1.

Overview of the miRNAs in relation to copy number aberrations. (A,B) Pie chart depicting the percentage number of aberrant events in GBM bearing the miRNA sites in both GISTIC‐ and RAE‐derived identifiers. (C,D) Pie chart depicting the percentage span in terms of length of aberrant regions bearing the miRNA sites in both GISTIC‐ and RAE‐derived identifiers. (E) Percentage number of miRNAs that are localized to the regions bearing copy number alterations as against the total number of miRNAs, depicted as a pie chart.
