Figure 4.

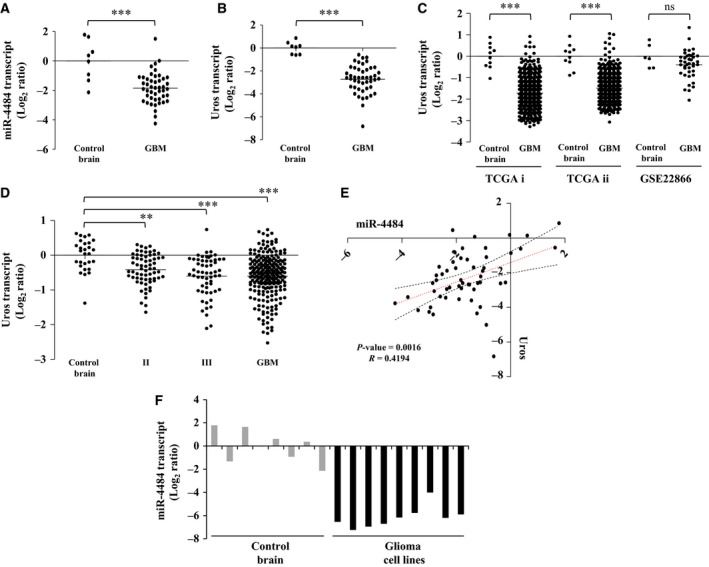
miR‐4484 and its host gene Uros are downregulated in GBM. (A,B) Log2‐transformed miR‐4484 and Uros expression values obtained from qRT‐PCR analysis indicating their downregulation in GBM, respectively. Each dot represents the data derived from one sample. For each sample, fold change in expression is calculated over its average expression in control brain tissue. (C) Log2‐transformed Uros expression ratios obtained from TCGA i (Affymetrix), TCGA ii (Agilent) and GSE22866 data sets indicating significant downregulation of Uros in GBM. (D) Log2‐transformed Uros expression ratios across different grades of glioma, obtained from the REMBRANDT data set indicating its significant downregulation from earlier grades. (E) The transcript expression values obtained from the qRT‐PCR experiment were used to assess the correlation in the expression of Uros and miR‐4484 in our sample cohort. A high positive correlation, with a correlation coefficient R = 0.4194 and P = 0.0016, was obtained. (F) Log2‐transformed miR‐4484 expression ratios across different glioma cell lines, SVG, T98G, LN18, LN229, U87, U138, U251, U343 and U373 (respectively from left to right, black solid columns) as compared to control brain tissue (grey solid columns). P‐values were calculated by Student's t‐test and one‐way ANOVA; the symbols indicated are explained as follows: *P < 0.05; **P < 0.01 and ***P < 0.001.
