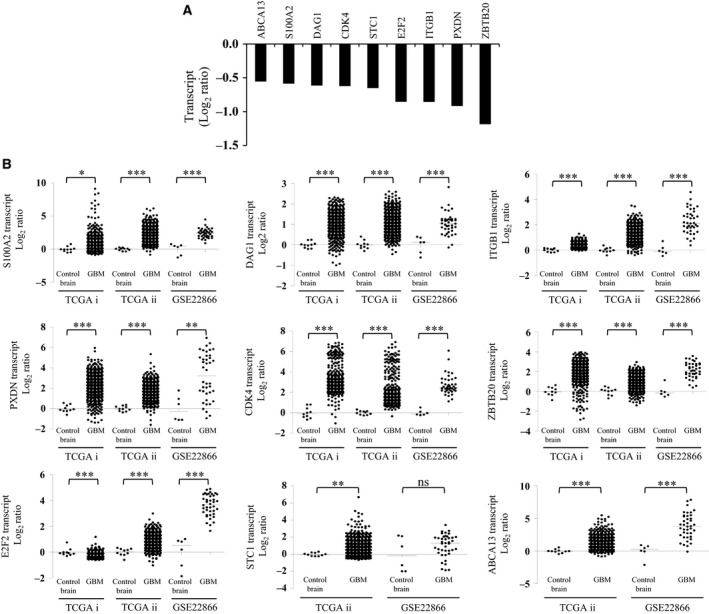
Figure 8.

Validation of the putative miR‐326 targets. (A) The column plot depicts the transcript levels of the putative targets of miR‐4484 upon pre‐miR‐4484 transfection, validated through qRT‐PCR analysis. (B) Transcript analysis of the putative targets of miR‐4484 in GBM. Data are derived from TCGA and GSE22866 data sets; TCGA i and TCGA ii refer to Affymetrix and Agilent platforms, respectively. P‐values were calculated by Student's t‐test, and the symbols indicated are explained as follows: nsnot significant; *P < 0.05; **P < 0.01 and ***P < 0.001.
