Figure 6.

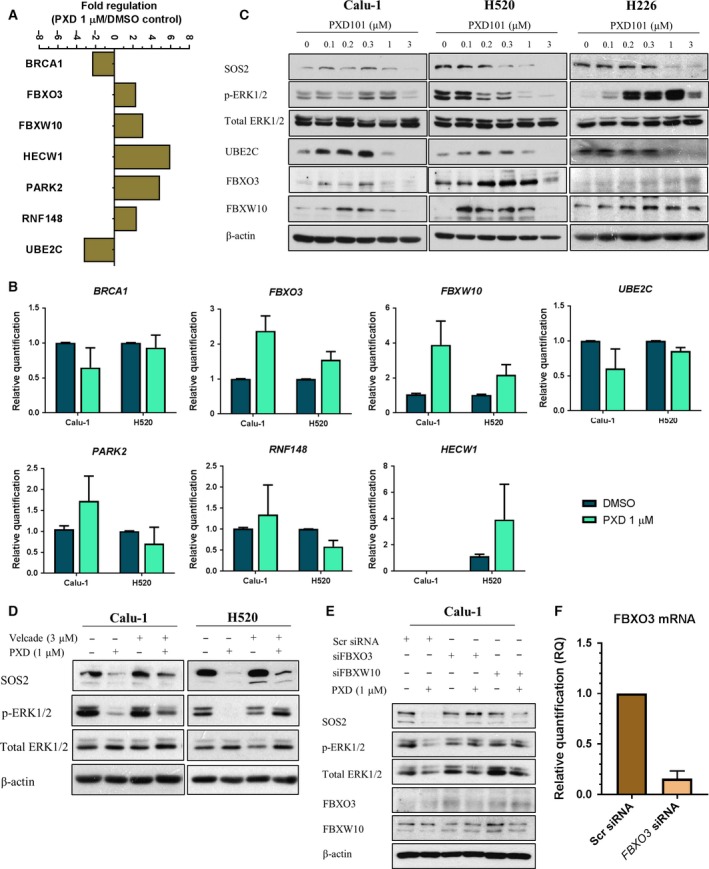
Regulation of ubiquitin gene expression profile upon belinostat treatment is associated with suppression of SOS/MAPK and could be rescued by bortezomib treatment. (A) Calu‐1 cells were treated with vehicle or belinostat (PXD101) (1 μm). Total mRNA transcript levels of 84 key ubiquitination genes were assessed with RT2 Profiler PCR Array. Data were presented as bar chart representing the relative value of the significantly altered genes (> twofolds) as compared to vehicle (n = 1). (B) The significantly altered genes identified from RT2 Profiler were verified with real‐time quantitative PCR (qPCR) in Calu‐1 and H520 cells treated with vehicle or belinostat (PXD101) (1 μm). Data were represented as average relative quantification ± SD (n = 3). (C) The genes regulated in the similar manner identified from qPCR were verified with immunoblotting in Calu‐1, H520, and H226 cells after treatment with vehicle or belinostat (1 μm). (D) Immunoblotting was performed to evaluate the effects of bortezomib (3 μm) on SOS2 and p‐ERK1/2 in belinostat‐treated cells. (E) Immunoblots show the effects of scrambled (Scr), FBXO3, or FBXW10 siRNA knockdown on affecting the modulation of belinostat on SOS/MAPK in Calu‐1 cells. (F) Knockdown efficiency of FBXO3 in Calu‐1 cells was confirmed with RT‐qPCR (n = 2). Fifty nanomolar siRNA was used per transfection. β‐Actin shown as loading control.
