
Figure 5.
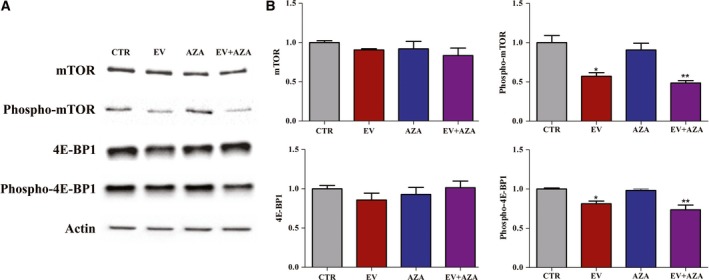
Effects of 2.1 nm everolimus (EV) and/or 1.4 × 10² nm 5‐aza‐2′‐deoxycytidine (AZA) on protein expression of total and phosphorylated mTOR and 4E‐BP1 in MZ‐CRC‐1 cells after 6 days of incubation. (A) Representative western blot analysis. Actin was used as a loading control. (B) Quantification of western blot analysis from at least three independent experiments. *P < 0.05; **P < 0.01.