
Figure 3.
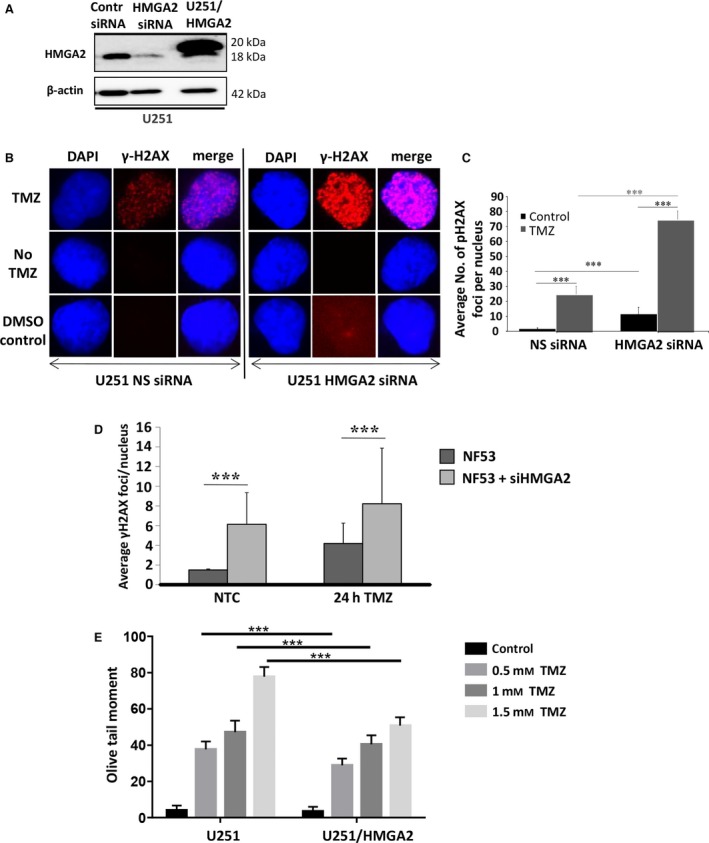
High‐mobility group protein A2 protects from TMZ‐induced DNA damage.(A) Western blot detection of successful HMGA2 KD upon specific siHMGA2 treatment in U251 cells. A scrambled sequence was used as control nonsilencing siRNA. U251 cells with stable overexpression of Flag‐tagged HMGA2 shown endogenous (18 kDa) and exogenous (20 kDa) HMGA2 were used for increased cellular HMGA2 levels. β‐Actin confirmed equal loading of protein samples. (B) TMZ treatment (1.5 mm) combined with HMGA2 KD resulted in an increased number and intensity of γ‐H2AX foci in U251 after 24h. The images show examples of single cell nuclei with γ‐H2AX foci shown in red and DAPI for nuclear counterstain in blue. (C) The average number of γ‐H2AX foci/nucleus was quantified from a total of 90 nuclei and three independent experiments (30 nuclei from each treatment and experiment). A significant increase in the average number of γ‐H2AX foci/nucleus was detected upon siHMGA2 vs. nonsilencing siRNA‐treated cells (black bars). An additional significant increase occurred upon TMZ treatment in U251 with siHMGA2 KD (gray bars). (D) As in human GB cells, HMGA2 silencing in mouse NF53 GB cells induced DNA damage as determined by increased number of nuclear γ‐H2AX foci. The DNA damage was further aggravated under TMZ at EC 50 (2 mm) for 24h. (E) Alkaline comet assays in U251 cells demonstrated that treatment with TMZ at 0.5, 1, and 1.5 mm for 24 h significantly increased DNA strand breaks as quantified by the olive tail moment. Exogenous HMGA2 overexpression diminished the TMZ‐induced DNA damage compared to endogenous HMGA2 levels. Graphs show SEM from three independent experiments; ***P < 0.001.