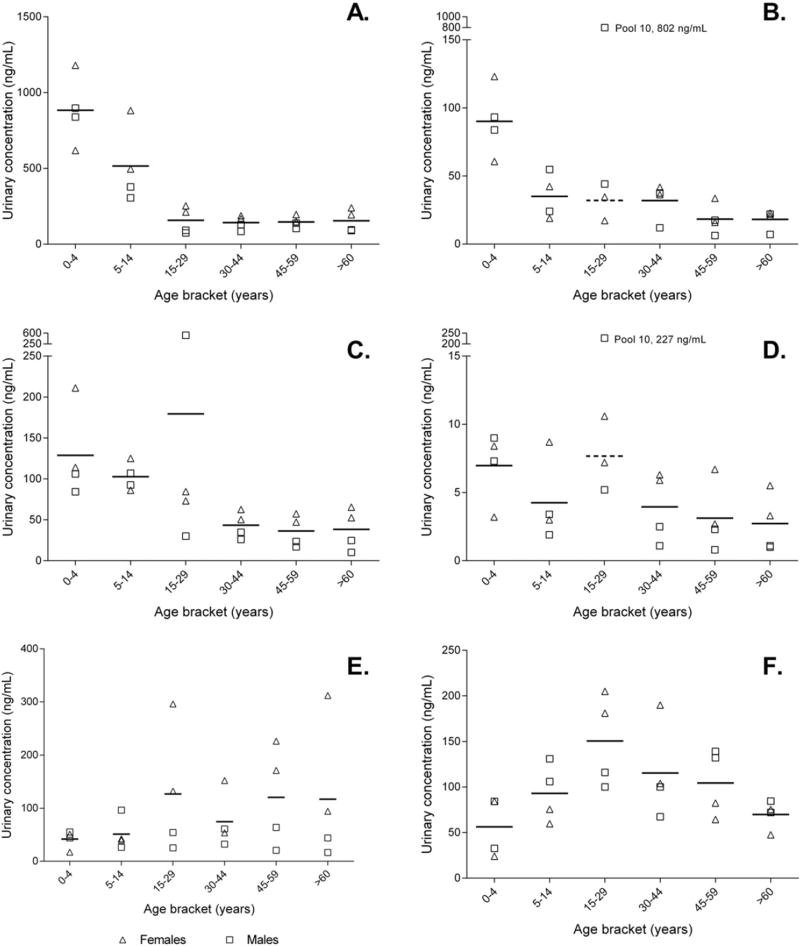
Fig. 1.
Urinary total concentration (ng/mL) versus age (years) for methyl-, ethyl-, propyl- and butyl paraben; and benzophenone-3 and triclosan (A to F, respectively). Triangles denote female pools, squares denotemale pools. Horizontal line indicates mean concentration of four pools in each age strata. Dashed horizontal line indicates mean concentration for age strata with outliers removed. Outliers labelled on ethyl- and butyl paraben plots.

